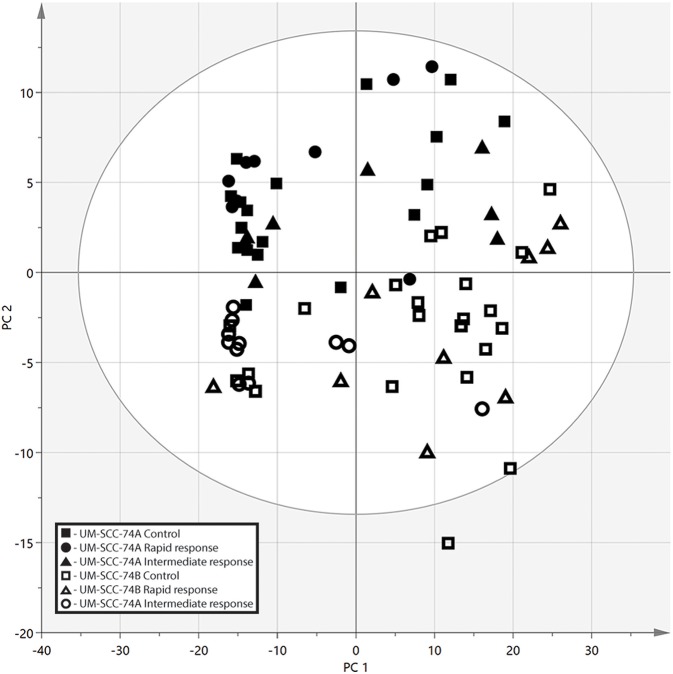
Figure 3.
PCA score plot from the metabolic profiling in negative ionization mode, the two SCC cell lines are separated along the second principal component (PC2). Along the first component (PC1) there is some separation between the controls and irradiated cells, however, no clear clustering. UM-SCC-74A Control (■), UM-SCC-74A Rapid response (4 h after 2 Gy irradiation) (▴), UM-SCC-74A Intermediate response (24 h after 2 Gy irradiation) (∙), UM-SCC-74B Control (□), UM-SCC-74B Rapid response (▵), and UM-SCC-74B Intermediate response (°).

