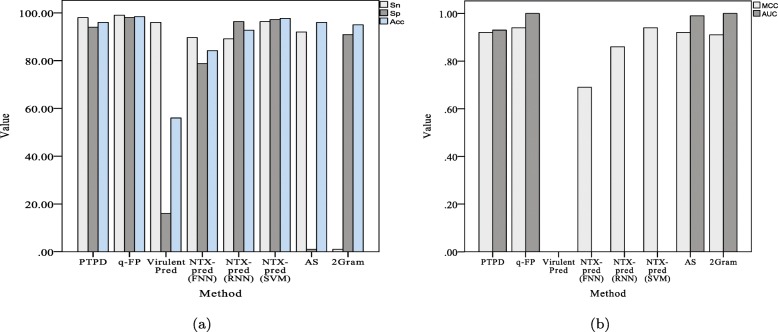
Fig. 4.
Comparison of different methods on the neurotoxin virulent proteins dataset. a Sn, Sp and Acc of different methods. b MCC and AUC of different methods. Sn: the sensitivity; Sp: the specificity; Acc: the prediction accuracy; MCC: Matthew’s correlation coefficient; AUC: the area under the curve of the receiver-operating characteristic curve

