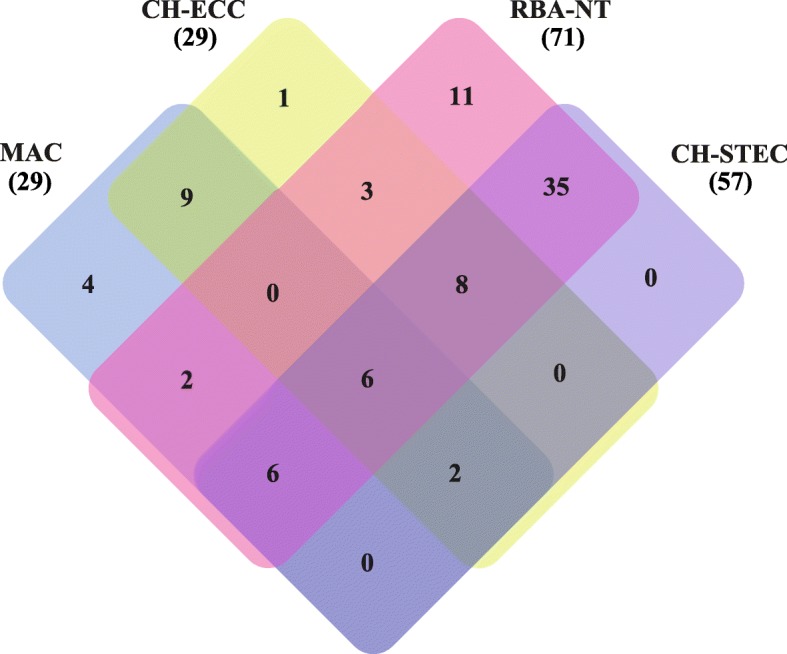
Fig. 1.

Venn diagram showing the numbers of common and unique samples that recovered STEC isolates on MAC, CH-ECC, RBA-NT, and CH-STEC agars. The number of culture-positive samples is listed in each of the diagram components. The total number of samples that recovered STEC isolates for each agar is given in parentheses
