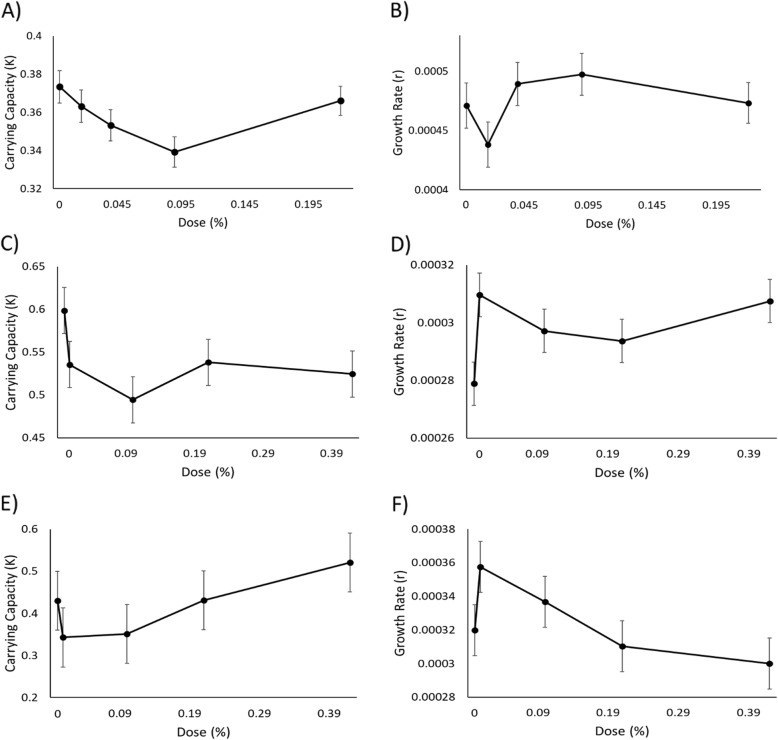
Fig. 1.
Estimates of the population parameters of bacterial species display the carrying capacity (left) in response to microdoses for E. coli (a), S. aureus (c), and P. aeruginosa (e) and the intrinsic rate of growth (right) in response to microdose for E. coli (b), S. aureus (d), and P. aeruginosa (f). Doses correspond to the percentage of arborvitae solution as indicated in Additional file 3: Table S1. Error bars are ±1 s.e.m.

