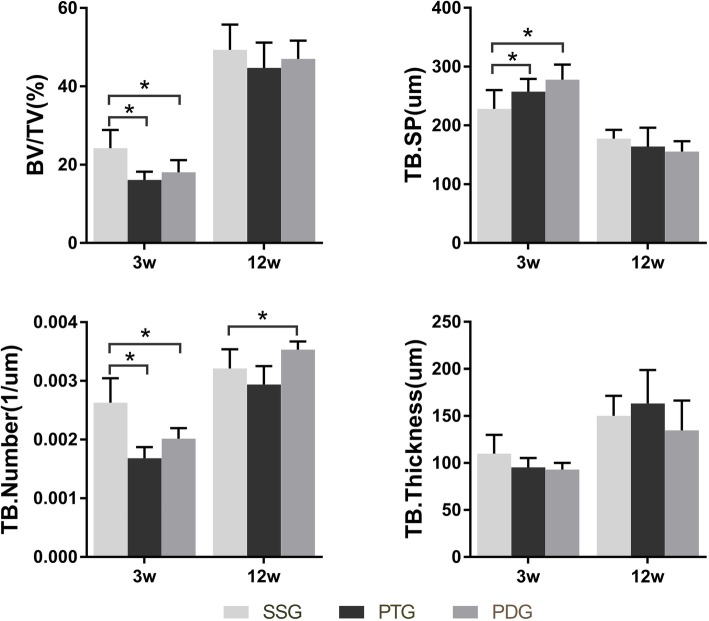
Fig. 8.
The quantity of trabecula under the trochlear groove through micro-CT analyze. The BV/TV, and TB. Number in the PG and PG were significantly decreased at 3 weeks (P < 0.05). The increase in TB. SP was a consistent result with the decrease of BV/TV, TB.N. The changes in quantity reflected that the interspace of trabecular was enlarged. No significant changes in TB. Thickness was found among the three groups at 3 weeks. No significant difference was found in the parameters among the three groups at 12 weeks

