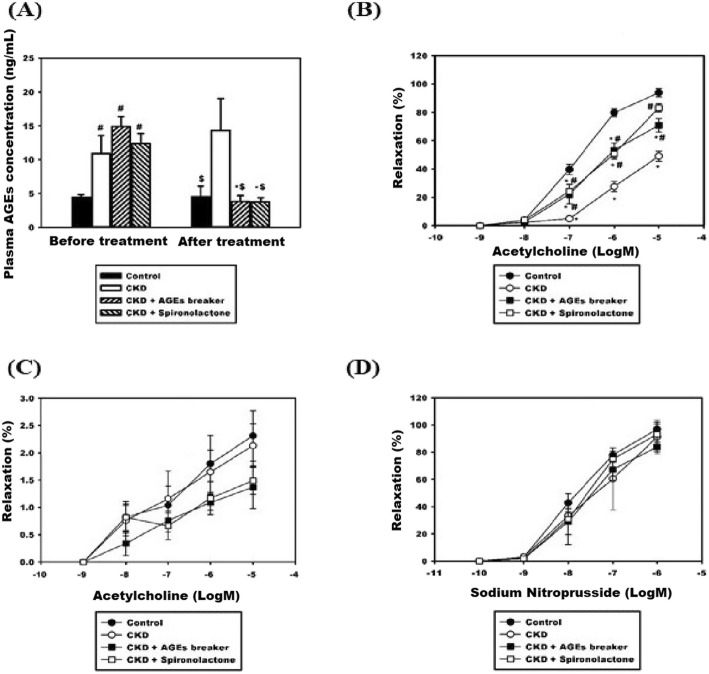
Fig. 2.
(a) Comparisons of plasma advanced glycation end products (AGEs) levels between groups and treatments. * Before versus. After treatments, p < 0.05; # any groups compared with the control group before treatment, p < 0.05; $ any groups compared with the control group after treatment, p < 0.05; (b) Comparisons of differences of Acetylcholine (Ach)-related vasorelaxation between groups. * any groups compared with the control group (Group 1), p < 0.05; # any groups compared with the CKD group (Group 2), p < 0.05. (c) Comparisons of inhibitory effect of N(omega)-Monomethyl-L-Arginine Acetate (L-NMMA) on the Ach-related vasorelaxation between groups. (d) Comparisons of sodium nitroprusside (SNP)-related vasorelaxation between groups

