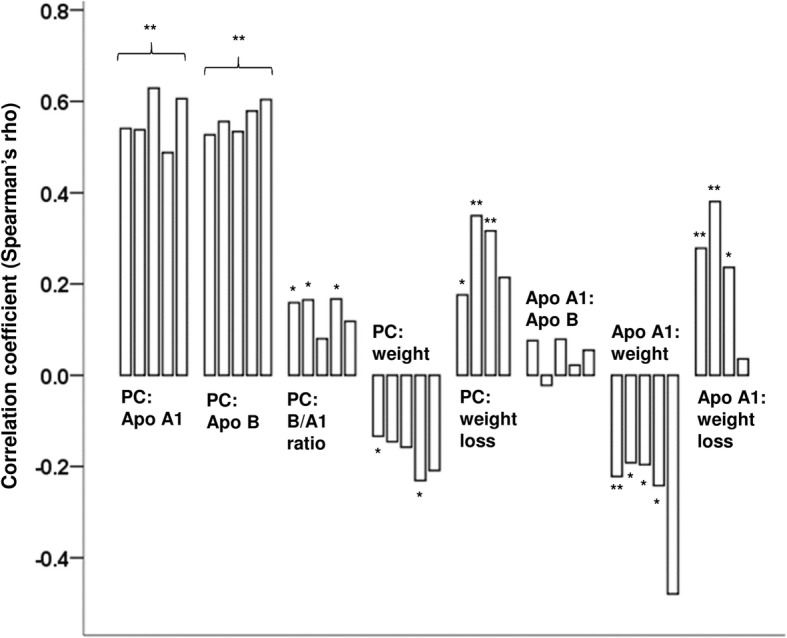
Fig. 2.

Correlations between PC, apolipoproteins, weight and weight loss and correlations between Apo A1 and Apo B, weight and weight loss. Starting from the left, bars represent correlation coefficients before surgery, 3, 6, 12 and 24 months after Roux-en-y gastric bypass (RYGB) surgery, respectively. For correlations to weight loss, the first bar is the correlation 3 months after RYGB. Significant correlations are shown as * (p < 0.05) and ** (p < 0.01). Correlations between PC and Apo A1 and B respectively, were all significant on the 0.01-level
