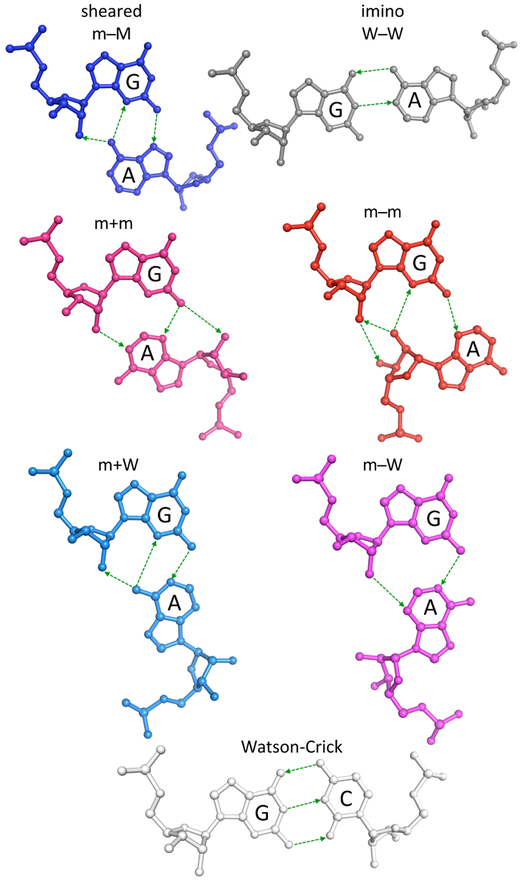
Figure 1.
Comparison of the hydrogen-bonding interactions, chemical structures, and relative spatial arrangements of nucleotides in the six dominant modes of G·A pairing and in a canonical Watson-Crick G−C pair. Hydrogen bonds shown by thin dashed lines, with arrows directed toward base/backbone atoms capable of accepting protons. Structures generated with 3DNA24 and rendered in PyMOL (www.pymol.org) using the average rigid-body parameters in Table 1 and a canonical A-RNA backbone.34 Structures depicted in the standard reference frame of G.30 Color-coding denotes the mode of base association: sheared m−M (dark blue); imino W−W (gray); m+m (pink); m−m (red); m+W (light blue); m−W (magenta); canonical (white), where the combinations of signs and letters denote the orientation (parallel +/antiparallel −) and the approximate sites (minor m/major M/Watson-Crick W edges) of base association.27 Interestingly, less than 10% of the + states reflect an anti-to-syn sugar-base rearrangement, and these examples all involve adenine.

