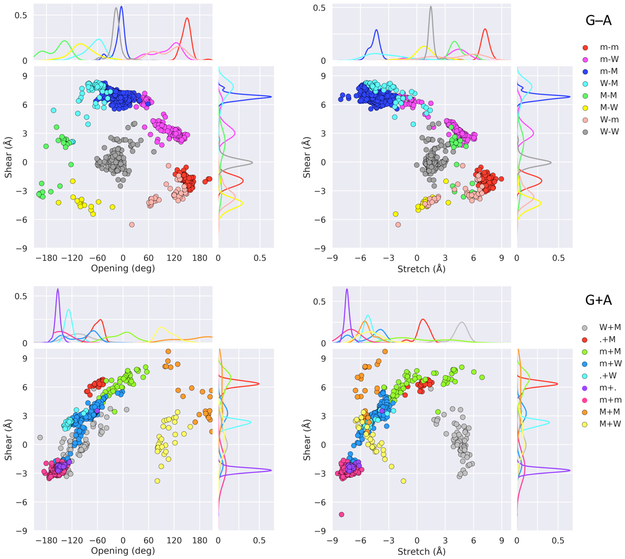
Figure 3.
Scatter plots of the rigid-body components — Shear, Stretch, Opening — that distinguish the modes of G·A association in RNA-containing structures. Smooth curves on the edges of the scatter plots are the normalized densities of individual parameters. Points with the magnitude of Opening in excess of 180° include requisite changes in the signs of Shear, Stretch, Buckle, and Propeller. Color-coding of dominant pairs matches that in Figures 1, 2. Secondary states with 16 or more structural examples are noted by related hues. Images depict the spread of values in the Shear-Opening (left) and Shear-Stretch (right) planes for antiparallel G−A (top) and parallel G+A (bottom) arrangements.

