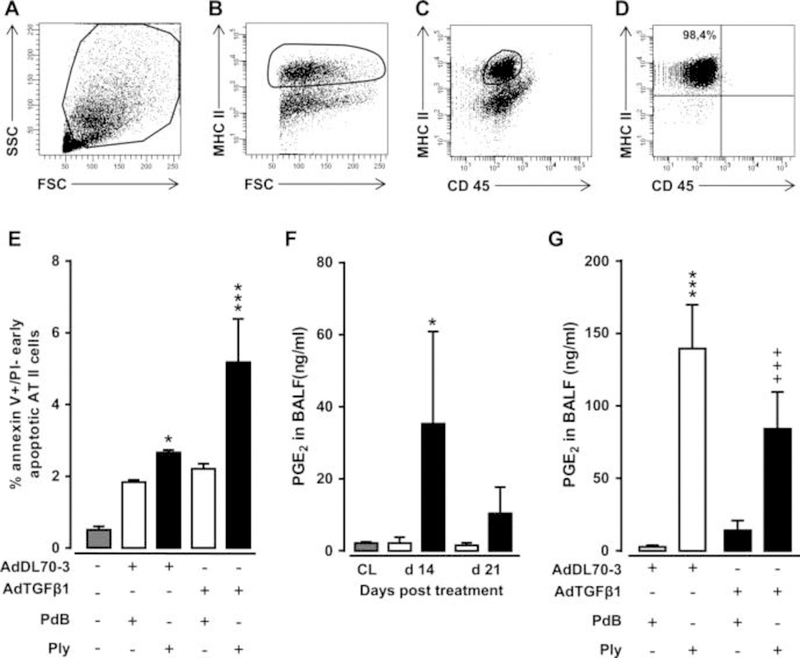
Figure 7. Effect of repetitive Ply challenge of AdTGFβ1-exposed mice on apoptosis and PGE2 levels of AT II cells.

(A–D) Gating strategy for flow sorting of AT II cells isolated on day 21 from the lungs of mice exposed to AdTGFβ1 for 14 days followed by repetitive PdB or Ply challenge, as outlined in the legend to figure 6F. (A–D) Pre-enriched AT II cells were stained with anti-MHCII and anti-CD45 antibodies in the presence of anti-CD16/32 Ab, and were then gated according to their FSC-A versus SSC-A characteristics (A), followed by hierarchical subgating according to their FSC versus MHC II (B) and CD45 versus MHC II (C) expression. (D) Post-sort analysis of sorted AT II cells revealed sort purities of >98%, as verified by modified Papanicolaou stain and electron microscopic detection of lamellar bodies (data not shown). (E) Percent of early apoptotic (annexin Vpos, propidium iodideneg) AT II cells purified from the lungs of untreated mice (grey bars), or mice challenged with control vector (white bars) or AdTGFß1 (black bars) for 14 days and PdB or Ply for 7 days, as outlined in the legend to (E). (F) PGE2 levels in BAL fluids of untreated mice (grey bars) or mice treated with control vector (white bars) or AdTGFβ1 (black bars) for the indicated time intervals. (G) PGE2 levels in BAL fluids of mice treated with control vector or AdTGFβ1 for 14 days, followed by repetitive treatment with PdB versus Ply on days 14, 15 and 16 post-vector treatment, as indicated. PGE2 levels were determined on day 17 after vector treatment. The data are shown as mean±SD of n=3 mice per time point and treatment group (n=5 mice per time point and treatment group in F), and are representative of two independently performed experiments. Data were analysed by two-way ANOVA (E and G) or Student’s t test (F). *p<0.05, ***p<0.001 compared with control vector, +PdB treatment and +++p<0.001 compared with control vector +Ply treatment. ANOVA, analysis of variance; FSC, forward scatter; PdB, pneumolysin derivative B.
