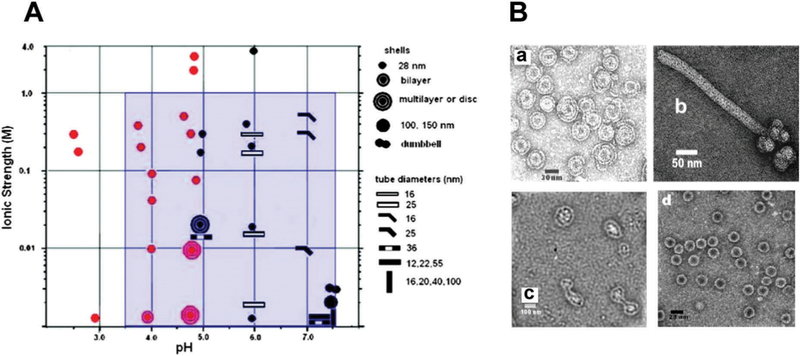
Fig. 13.
The range of particle morphologies possible of CCMV assembly as a function of pH and ionic strength. (A) Phase diagram of protein assembly outcome over a range of pH and ionic strength. Samples were buffered with sodium cacodylate (red) or sodium citrate (black). The blue area represents conditions of assembly from ref. 168 and 169. (B) Electron microscopy images of different observed morphologies. (a) Multishelled structures are dominant at pH 4.8 and I = 0.01. (b) Tubular structure observed at pH 6.0 and I = 0.01 (c) Dumbbell shaped particles at pH 7.5, 0.001 M cacodylate buffer.(d) Single walled shells at pH 4.67 and 0.1 M acetate buffer and I = 0.1 Figure reproduced from ref. 56 with permission from the American Chemical Society, copyright, 2009.

