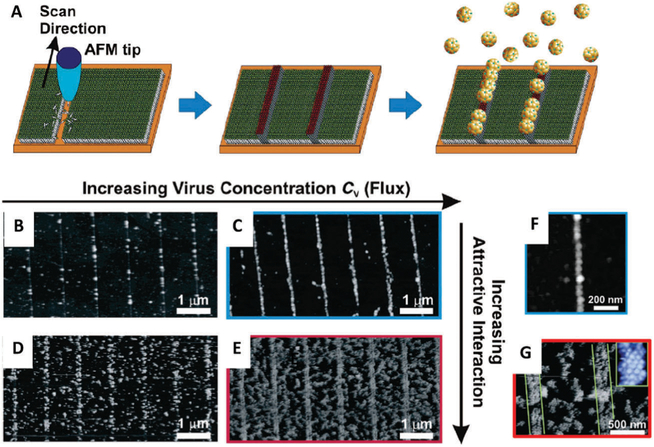
Fig. 25.
(A) Schematic of nanografting and virus deposition process. (A) A Ni-NTA terminated surface is created at specific locations on a gold substrate (red lines) to allow for deposition of His-tagged CPMV (yellow spheres) via Ni(ii) chelation. (B–E) AFM images showing the coverage of the CPMV on the substrate as well as the increasing order observed by increases in virus concentration (flux) and increasing inter-viral attractive interaction (increasing PEG concentration). (B) At a condition of low flux and weak inter-viral attractive interaction (0 wt% PEG), His-CPMV attaches almost exclusively to the Ni-NTA line, but the coverage is low. (C) At higher flux with weak interaction, His-CPMV still exclusively attaches to the line, but with increased coverage. (D and E) As the inter-viral interaction is increased (by addition of 1 wt% PEG), virus assembly spreads outward from the lines, and clusters of viruses lie between the lines.(F) Higher resolution AFM image of condition (C), showing His-CPMV alignment at a single capsid width. (G) Higher resolution image of condition (E), showing ordered packing of virus capsid on the Ni-NTA line. Figure reproduced from ref. 335 with permission from the American Chemical Society, copyright 2006.

