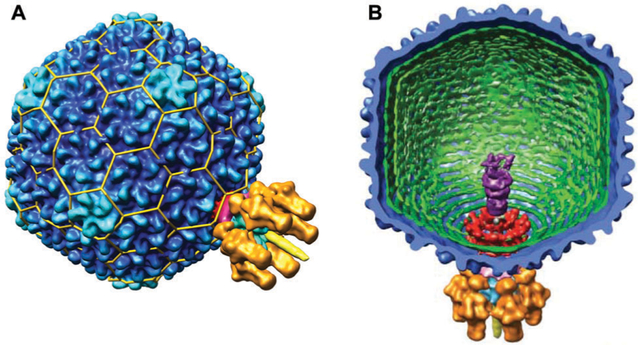
Fig. 3.
(A) A surface volume reconstruction image of the infectious P22 virion. The T = 7 organization is indicated by the yellow lattice cage. The portal complex is located at one of the 5-fold vertices. CP (gp5) is in dark blue. (B) A cutaway interior view of the infections P22 virion. The gene products of the tail machinery are shown in different colors: gp1 (red), gp4, (magenta), gp7, 16, and 20 (purple), gp9 (orange), gp10 (light blue), and gp26 (yellow). Figure reproduced from ref. 43 with permission from AAAS, copyright 2006.

