
Figure 5.
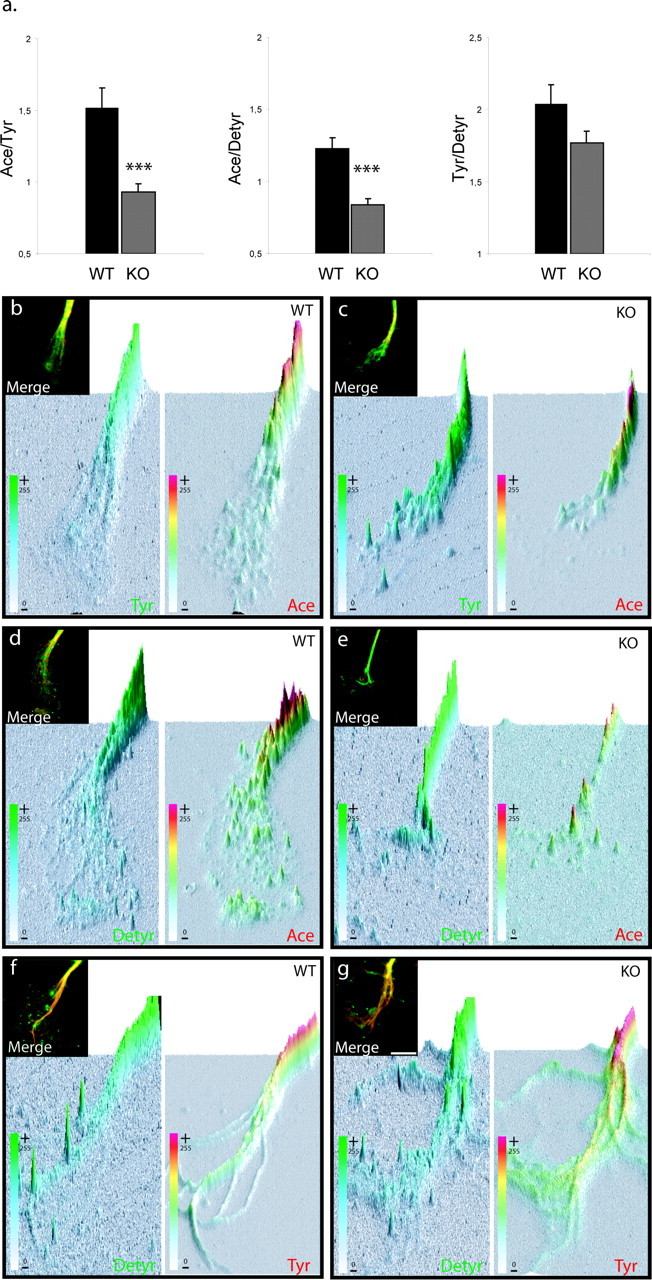
map1b-/- growth cones display reduced relative amounts of acetylated tubulin immunostaining. a, Immunofluorescence ratios (arbitrary units) were calculated for map1b+/+ [wild-type (WT)] and map1b-/- [knock-out (KO)] growth cones between, acetylated and tyrosinated tubulin (Ace/Tyr), acetylated and detyrosinated tubulin (Ace/Detyr), and tyrosinated and detyrosinated tubulin (Tyr/Detyr). Quantitative and statistical analysis shows that both ratio Ace/Tyr and Ace/Detyr are significantly lower in map1b-/- than map1b+/+ growth cones, whereas the Tyr/Detyr ratio is not significantly different between the two genotypes. ***p < 0.001; ANOVA-1; n = 40 for each condition. b-g, Example of double immunofluorescence of map1b+/+ (WT) and map1b-/- (KO) growth cones for each condition presented in the diagrams in a. The insets show examples of original merged images of double-immunostained growth cones, from which three-dimensional graphs were created (Image Pro Plus program), representing the spatial distribution of individual colors in the growth cone and their pixel intensities on the z-axis (also color-coded). Scale bar, 5 μm.