
Figure 3.
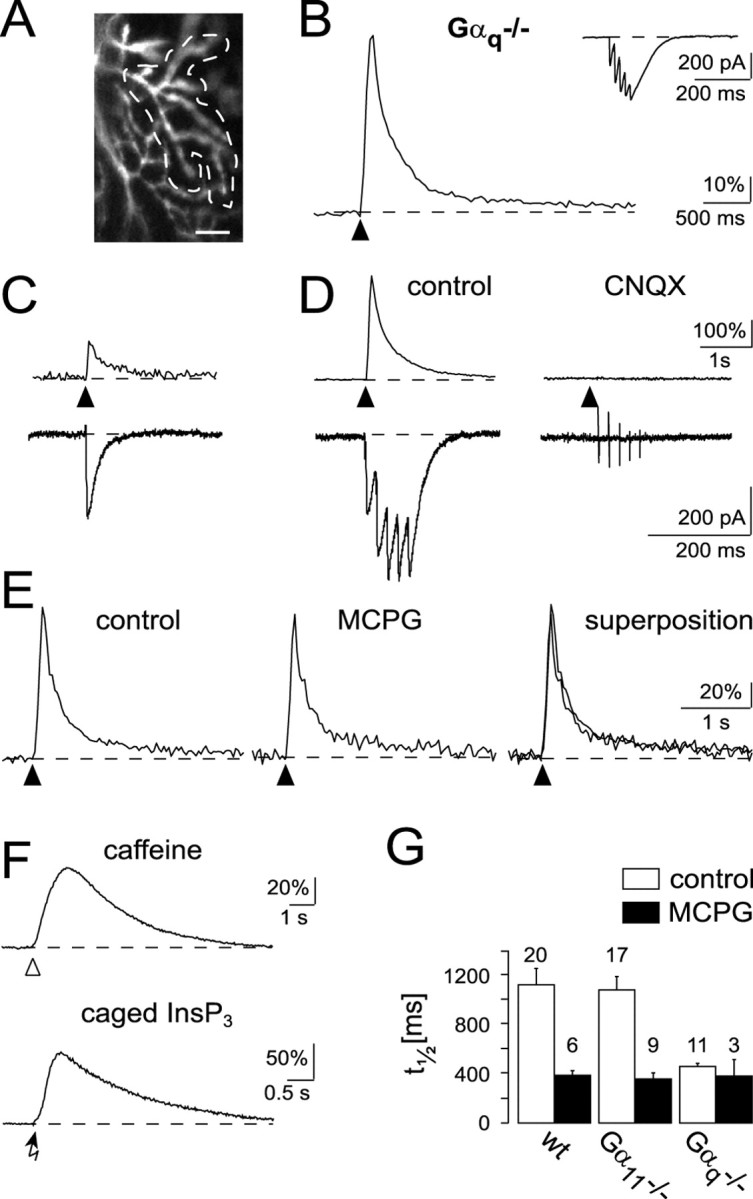
Ca2+ signaling in Purkinje cells of Gαq-deficient mice. A, Confocal image of the active dendritic region of a Purkinje cell responsive to repetitive stimulation of a beam of PFs (5 pulses; 13 V, at 50 Hz; scale bar, 10 μm). B, Ca2+ response recorded from the active microdomain (region within the dashed line) in A. The inset shows the corresponding EPSC. C, Ca2+ transient and EPSC in response to a single synaptic stimulation pulse (10 V). D, Ca2+ transient and EPSC in response to repetitive stimulation (5 pulses of 10 V at 50 Hz) in the same input as in C. Note the larger amplitude but the monotonic decay of the Ca2+ transient (left). The synaptic response was blocked by 10 μm CNQX (right). E, Absence of an MCPG-sensitive Ca2+ response component (2 mm MCPG). F, Ca2+ transients evoked by caffeine application (top, open arrowhead) or by a 3 msec UV pulse (bottom, arrow) applied to a Purkinje cell loaded with caged InsP3 (150 μm). Recordings were obtained from two different Purkinje cells. Each trace is an average of four consecutive responses separated by 3–4 min. The holding potential was –50 mV (caffeine application) and –70 mV (InsP3 uncaging). G, Quantitative comparison of synaptically evoked Ca2+ responses in mutant and in wild-type mice. The time point at which the amplitude of the Ca2+ response was half of the amplitude of the ESCT was defined as t1/2. The bar graph shows the t1/2 values obtained in the three genotypes under control conditions (□) and in the presence of MCPG (▪). The numbers of experiments included in the analyses are indicated on top of each bar.