
Figure 2.
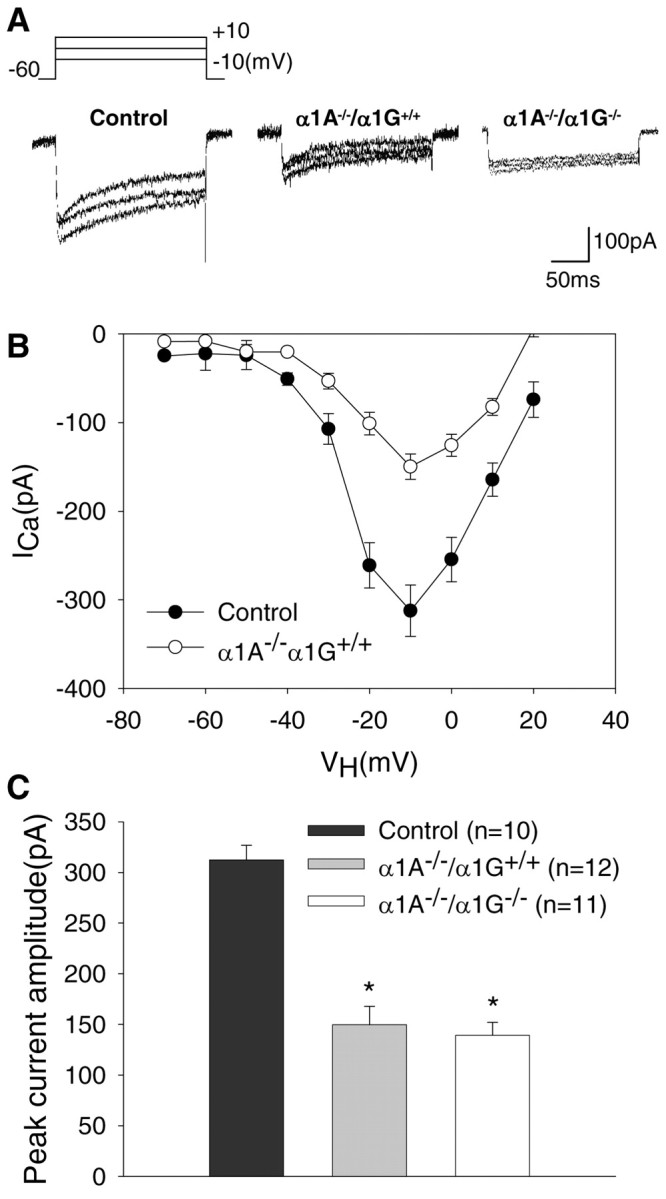
HVA Ca2+ currents in acutely isolated thalamic relay neurons. A, Representative traces of total Ca2+ currents of control, α1A–/–/α1G+/+, and α1A–/–/α1G–/– TC neurons evoked by stepping membrane potential voltages between –10 and +10 mV in 10 mV increments from a holding potential of –60 mV. Sustained HVA Ca2+ currents decayed slowly during the 200 msec step commands. B, Mean peak I–V curves for total Ca2+ currents in TC neurons show different features between the two groups. The I–V relationship at this voltage protocol shows that the HVA Ca2+ currents in α1A–/–/α1G+/+ cells were dramatically reduced at all testing voltage steps above –40 mV compared with those in control. Symbols represent pooled data from α1A–/–/α1G+/+ (open symbols; n = 8) and control mice (filled symbols; n = 10). C, The HVA Ca2+ histogram of peak amplitude is at –10 mV in control (black bars; n = 10), α1A–/–/α1G+/+ (gray bars; n = 12), and α1A–/–/α1G–/– (white bars; n = 11), with holding potential at –60 mV. Note that the peak amplitude of HVA Ca2+ currents in α1A–/–/α1G+/+ and α1A–/–/α1G–/– mice was decreased significantly more than in α1A+/+/α1G+/+ mice(*p<0.001; two-tailed t test). No statistically significant changes occurred in the HVA Ca2+ current of α1A–/–/α1G–/– mice compared with that from TC neurons of α1A–/–/α1G+/+ mice (p > 0.05). Control indicates α1A+/+/α1G+/+.