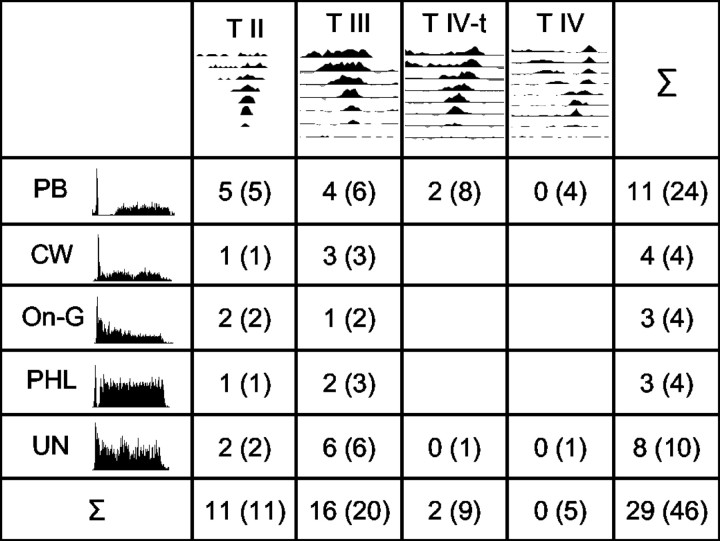
Figure 2.
Number of units for which response to the signal was significantly enhanced in the CM condition, relative to the RF and CD conditions, as a function of PSTH (rows) and response map type (columns). The total number of units for each category is given in parentheses, and Σ represents the total number of units for each PSTH and response map type. Improvement in signal representation was estimated by the change in mean spike rate in the signal window relative to the no-signal condition (see text). PB, Pause-build; CW, wide chopper; On-G, onset with graded response; PHL, phase-locking; UN, unusual; T II-T IV, response map types II to IV.

