
Figure 3.
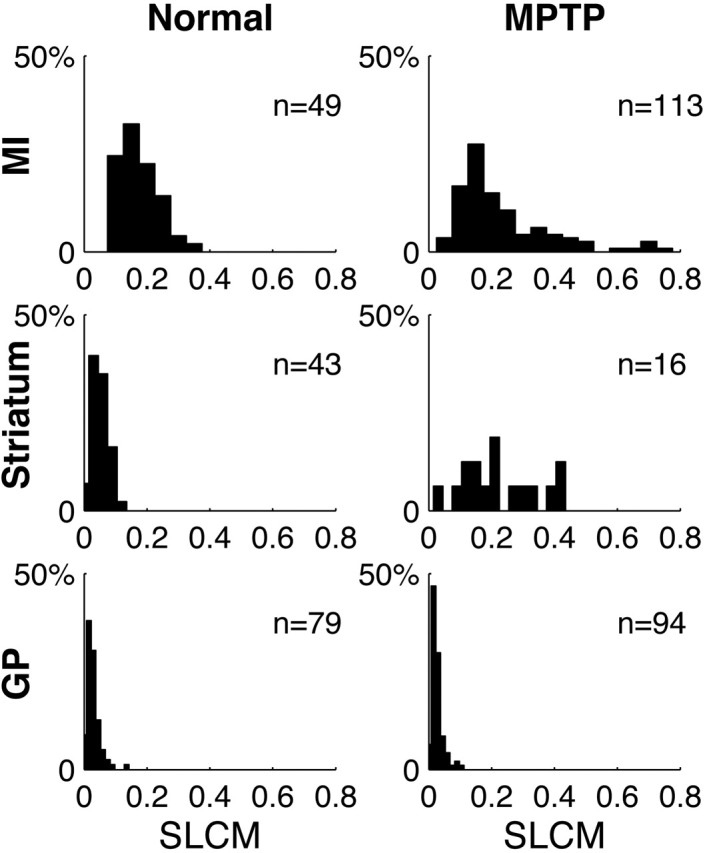
Distribution of the SLCMs between spikes and the LFP. Frequency histograms of the SLCMs from all structures in both the normal and the MPTP-treated conditions in monkey S. The number (n) of units used to generate the histogram is indicated.