
Figure 3.
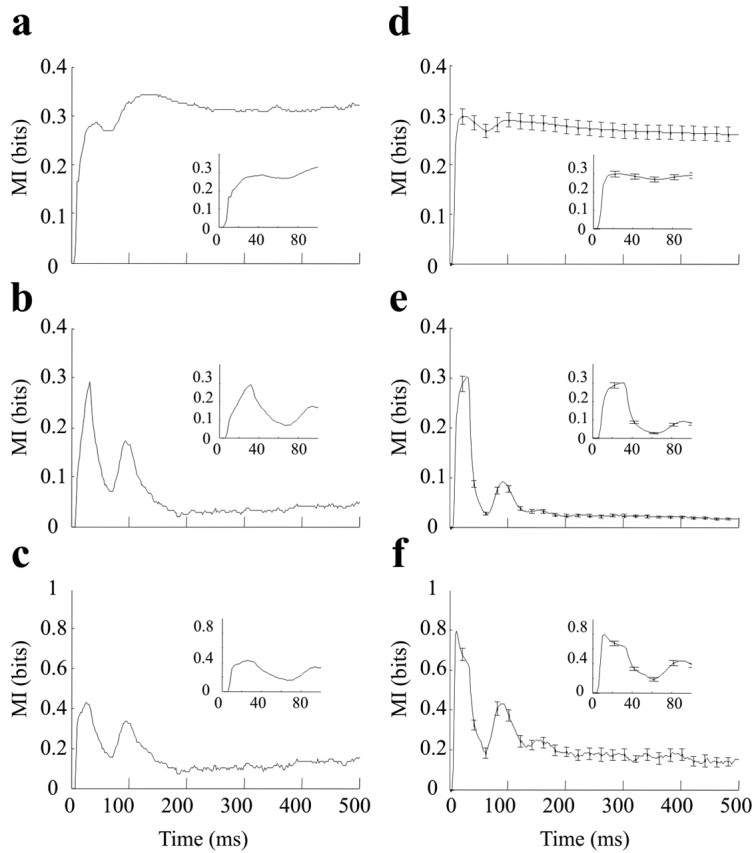
Time course of information of ∼49 stimuli carried by a single neuronal cluster (left) and by all clusters (right). a, Cumulative information: spike counts measured from stimulus onset until the time indicated on the x-axis. b, Ongoing information: spike counts measured in the 25 msec time window preceding the time indicated on the x-axis. c, Information per spike, calculated by dividing ongoing information (b) by the average number of spikes in each time window. d-f, The same plots in a-c averaged over all 130 neuronal clusters recorded in experiments 1-5. In all plots, the inset is a magnified view of the earliest part of the curve (0-100 msec).