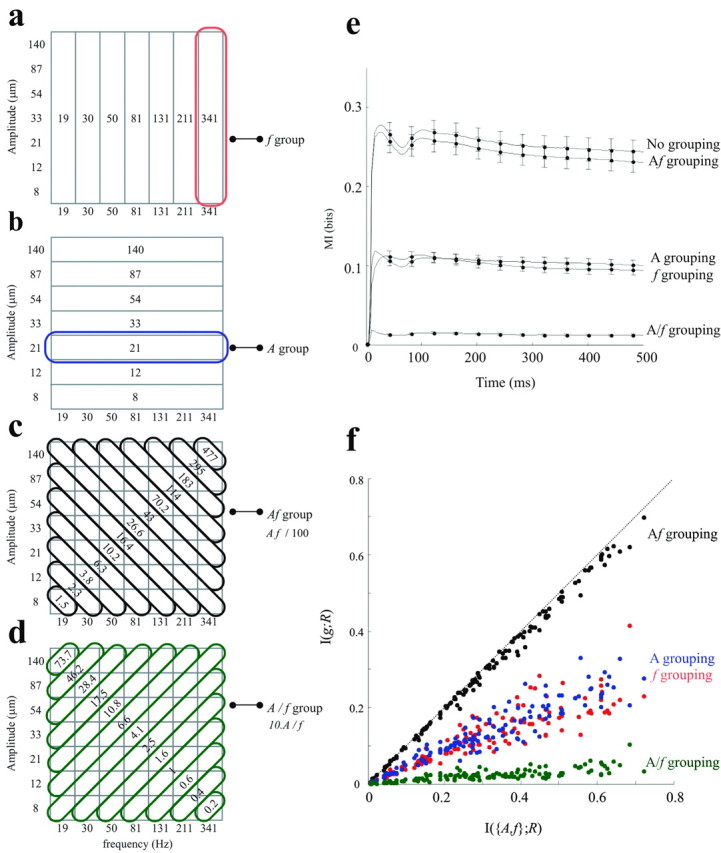
Figure 4.

Stimulus grouping rules and their effect on information transmission. a-d, Four different stimulus grouping rules. a, Stimuli grouped into seven vertical iso-frequency bands. For the information analysis, all vibrations possessing the same frequency value were considered to be the same stimulus. The defining value is given within the band. b, Stimuli grouped into seven horizontal iso-amplitude bands. c, Stimuli grouped into 13 diagonal iso-speed bands. Within each band, the value of the product Af is given. d, Stimuli grouped into 13 diagonal A/f bands; orthogonal grouping. e, Cumulative information about the stimulus set grouped according to the features f, A, Af, and A/f plotted against the upper limit, the information about the entire set of 49 stimuli (no grouping). The data with no grouping are carried over from Figure 3d. Each curve represents the average from 130 neuronal clusters recorded in experiments 1-5. Error bars are the SEs of the mean across clusters. f, The effect of stimulus grouping on each neuronal cluster. For each neuronal cluster, the quantity of information transmitted was taken to be the maximum value of cumulative information curve. The x-axis denotes the information carried about the full stimulus set, and the y-axis denotes the information for the same neuronal cluster when stimuli were grouped according to a selected rule.
