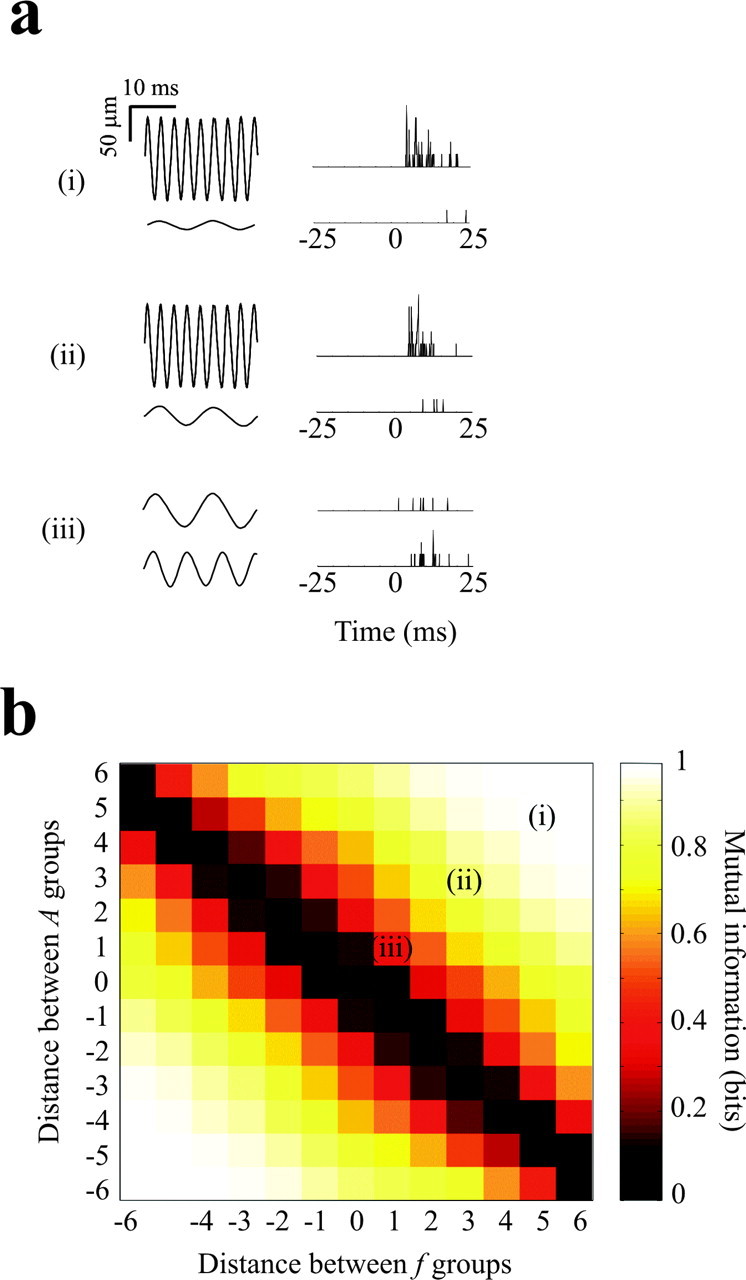
Figure 6.

Discriminability between pairs of stimuli. a, Three pairs of sinusoidal vibrations and associated single-trial neuronal responses. Each response is the result of pooling the activity across all 37 electrodes in experiment 3. Illustrated responses were selected randomly from the 150 trials for each stimulus. b, Information carried about pairs of stimuli. To make the graph, all stimulus pairs were classified according to f1-f2 and A1-A2, in which the frequency and amplitude distances refer to steps along the selected dimension (see Fig. 4a,b). The color of each element in the graph gives the average information about all stimulus pairs with the indicated values of f1-f2 and A1-A2. Information is measured from the whole-array pooled spike count in the interval 0-25 msec after stimulus onset.
