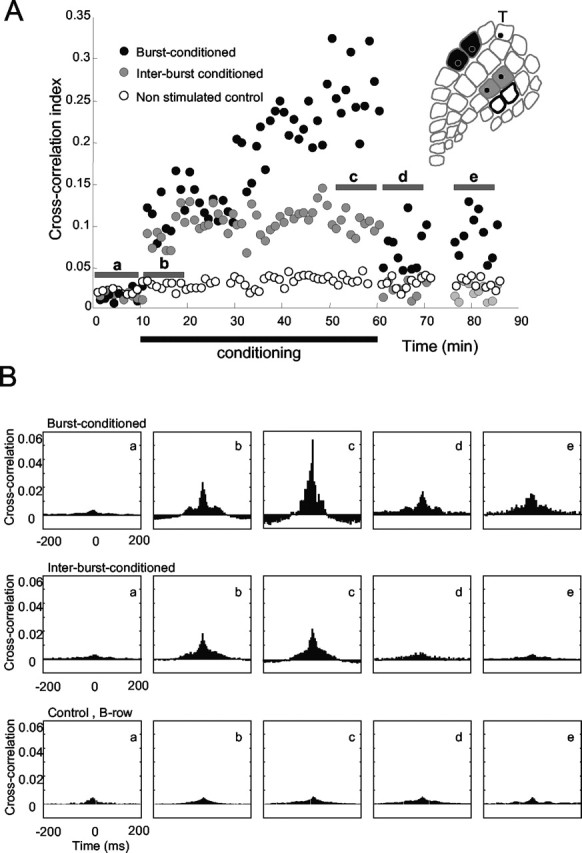
Figure 5.

State-dependent changes in intercolumnar connectivity. A, Cross-correlation index between neurons in burst-conditioned columns (E2 and E3; black points), between neurons in inter-burst-conditioned columns (C2 and C3; gray points), and between neurons in nonstimulated control columns (B2 and B3; white points). B, CCHs constructed from activity measured during intervals a-e in A. CCHs for the columns receiving burst-conditioning pairing increased during conditioning and remained elevated. The site of the trigger electrode is indicated by T.
