Figure 1.
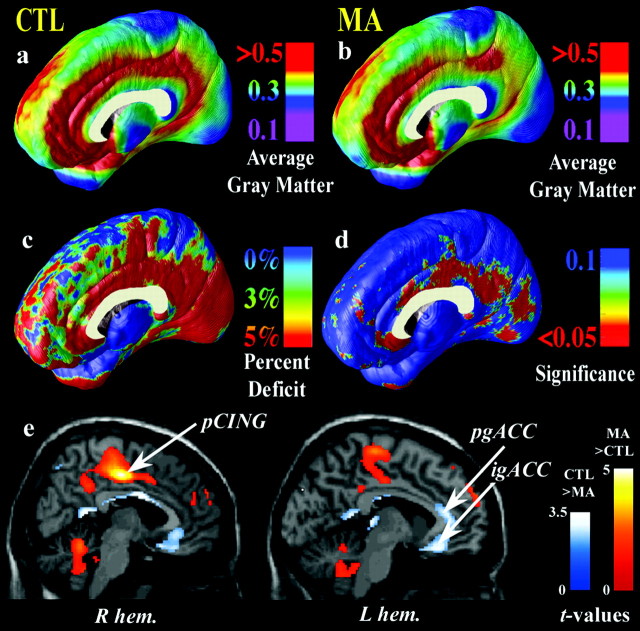
Gray-matter differences on the medial brain surface. Group difference maps (c) show mean percentage differences in gray-matter volumes between the control group average (a) and the methamphetamine group average (b), according to the color bar. The significance of these reductions is plotted in d as a map of p values. The cingulate gyrus shows highly significant gray-matter deficits (red colors; p < 0.034, corrected), whereas other brain regions are comparatively spared (blue colors). e is from London et al. (2004) (reprinted with permission). It shows the locations of MA (n = 17) and control (n = 18) group differences in relative regional cerebral metabolic glucose rate, assessed with PET. This PET sample partially overlaps with the current sample assessed with MRI. Briefly, in e, statistical parametric maps reveal regions in which the MA group has greater (red colors) or lesser (blue colors) glucose metabolism. Colors superimposed on a gray-scale MRI template indicate areas in which the significance of the group difference was t ≥ 1.69 (p = 0.049). The region of greatest gray-matter deficit (b, d) is in the right hemisphere posterior cingulate cortex (pCING), and so is the region of greatest metabolic increase in the MA group (e). This suggests an anatomical congruence of the MRI-based deficits with metabolic differences observed with PET. igACC and pgACC denote the inferior and perigenual anterior cingulate cortex, respectively. CTL, Control; R hem, right hemisphere; L hem, left hemisphere.

