
Figure 1.
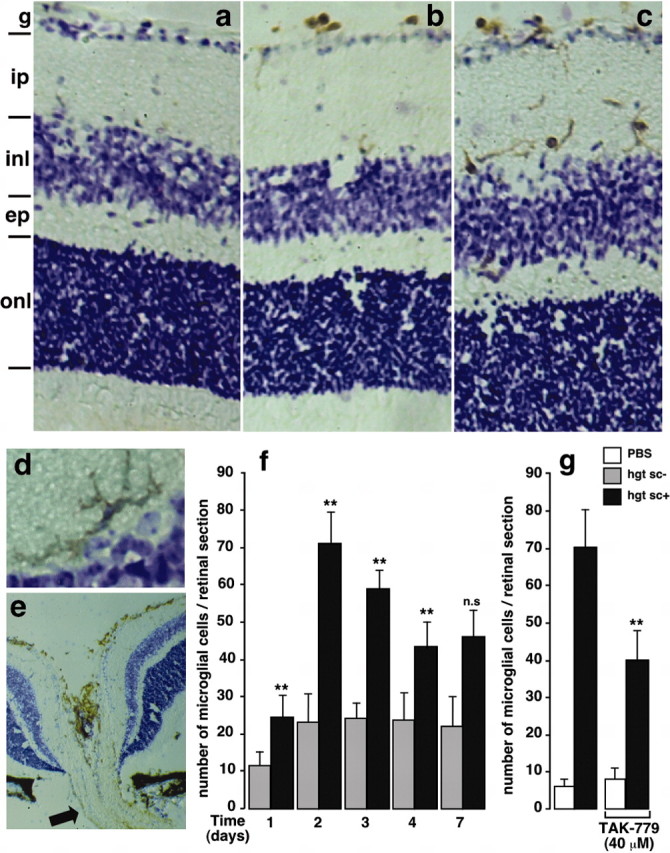
In vivo microglial cell recruitment after intraocular injection of hgtsc+. Immunohistochemical staining of retinal microglia (brown) expressing CD11b/CD45 epitopes 2 d after injection of PBS (a), hgtsc- (b), and hgtsc+ (c-e) into mouse eyes. A typically ramified microglia cell 2 d after hgtsc+ injection (d) and a representative retinal section through the optic nerve (e, arrow) are shown. Cell layers: g, ganglion cell; ip, internal plexiform; inl, inner nuclear; ep, external plexiform; onl, outer nuclear. Immunopositive microglial cells are brown; the counterstain is cresyl violet. Magnification: a-c, e, 10×; d, f, 40×. Quantification of the number of microglial cells per retinal section as a function of time after intravitreal inoculation of hgtsc- (gray bars) or hgtsc+ (black bars). The number of immunopositive cells was obtained by counting 90 independent retina sections corresponding to the whole eye from three treated mice in two separate experiments. Statistical significance as calculated by Student's t test: **p < 0.01 and not significant (n.s.) between day and d 1 in hgtsc+- treated animals, except for d 1, for which calculations were performed between hgtsc+- and hgtsc-- treated mice. g, Inhibitory effect of TAK-779 on the in vivo microglia migration 2 d after hgtsc+ injection. One microliter of hgtsc+ (black bars) or vehicle (white bars) was injected intravitreally in the presence or absence of TAK-779 (40 μm). Retinal sections were processed through the immunohistology methods described in Materials and Methods. Statistical analysis (**p < 0.01) between hgtsc+ treatment conditions with and without TAK-779 is shown. Histograms show the mean ± SD of two independent experiments (n = 2) in which each condition represents three mice injected unilaterally.