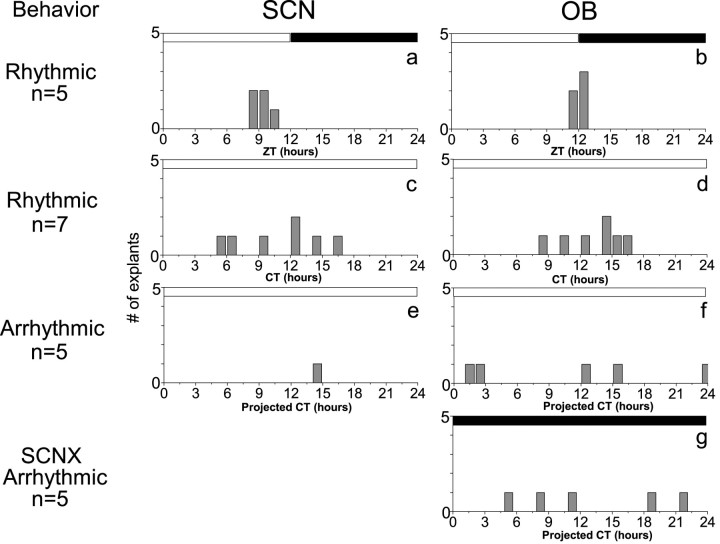
Figure 3.
The time of peak Per1-luc expression in SCN and OB cultures was tightly regulated in LD but disrupted by LL. The time of the first peak of each explant in bioluminescence provided a phase marker for in vivo rhythmicity relative to the time of light onset in the animal colony (ZT 0), activity onset (CT 12), or projected activity onset had they remained behaviorally rhythmic (CT 12). a, b, SCN cultures from animals kept in LD cycles peaked ∼9.5 hr after the time of projected dawn (ZT 9.5 hr; p = 0.001; r = 0.98; Rayleigh test), whereas OB cultures peaked ∼2.5 hr later (ZT 12.0 hr; p = 0.001; r = 0.98). c, d, SCN cultures from rhythmic animals kept in LL did not show significant phase clustering (p = 0.1; r = 0.57). OB cultures from the same animals, however, peaked at CT 10.7 hr (p = 0.006; r = 0.8). e, f, Of the subset of animals that became behaviorally arrhythmic in LL, only one had a rhythmic SCN in vitro, although all had rhythmic OBs that peaked at variable times (p = 0.7; r = 0.3). g, Similarly, the OB of animals rendered behaviorally arrhythmic by SCN ablation also showed a broadened distribution at peak times (p = 0.47; r = 0.4). The times of the previous light (open bars) and dark (filled bars) schedule are shown above each plot.

