
Figure 7.
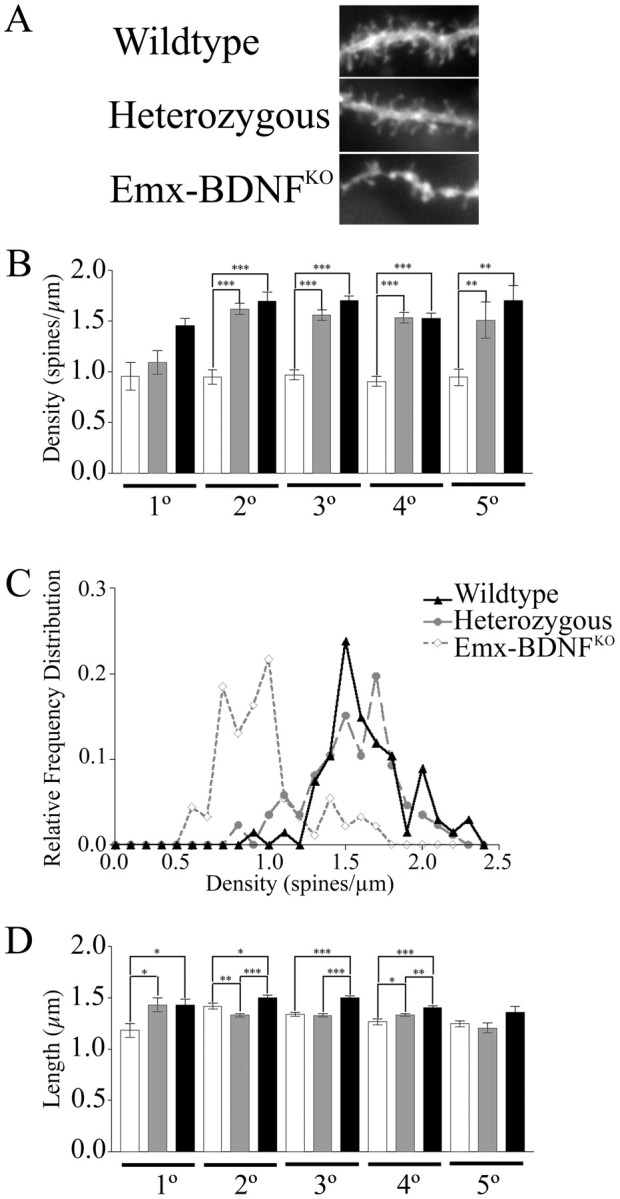
Reduced MSN spine density and length in Emx-BDNFKO mice. A, Representative images of DiI-labeled dendrite segments from the various genotypes at P35. B, Spine density per unit length of dendrite for different orders of dendrites. C, Relative frequency distributions of spine densities for each of the genotypes for pooled dendritic orders. D, Spine lengths for multiple orders of dendrites (Emx-BDNFKO as percentage of wild type: 1°, 90.1%, p < 0.05; 2°, 83.6%, p < 0.001; 3°, 89.1%, p < 0.01; 4°, 87.4, p < 0.05; 5°, 92.3%, p > 0.05; *p < 0.05; **p < 0.01; ***p < 0.001; one-way ANOVA with a Tukey post hoc test). White bars are Emx-BDNFKO, gray bars are heterozygotes, and black bars are wild type.