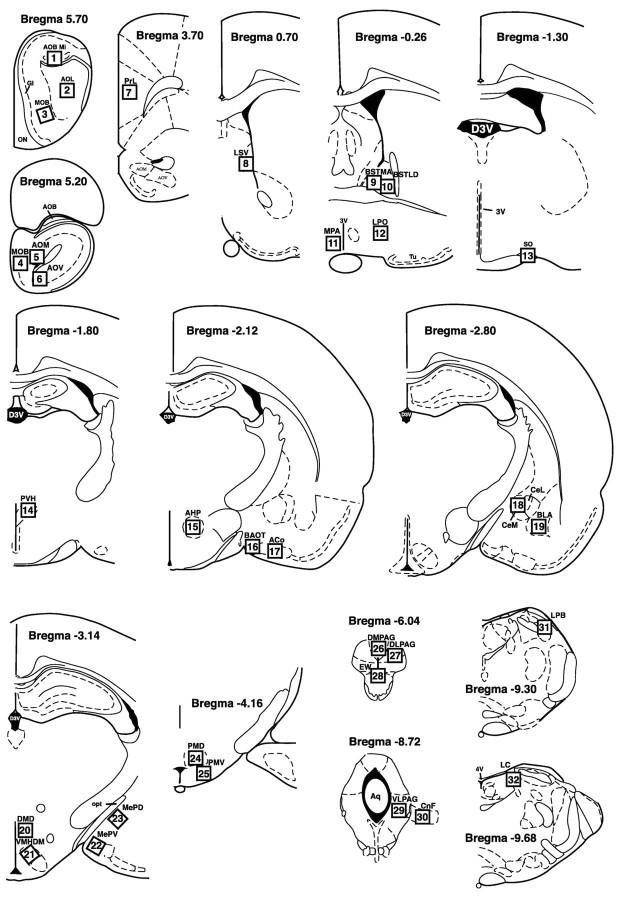
Figure 1.
Schematic diagram of brain regions counted in coronal sections. The figure is adapted from the atlas of Paxinos and Watson (1997) and shows the 32 regions in which Fos immunoreactivity was quantified in the coronal plane and reported in Table 1. Open squares indicate the approximate positions of the grid within which the Fos counts were made. For counts of Fos-immunoreactive cells corresponding to this diagram and abbreviations, see Table 1.

