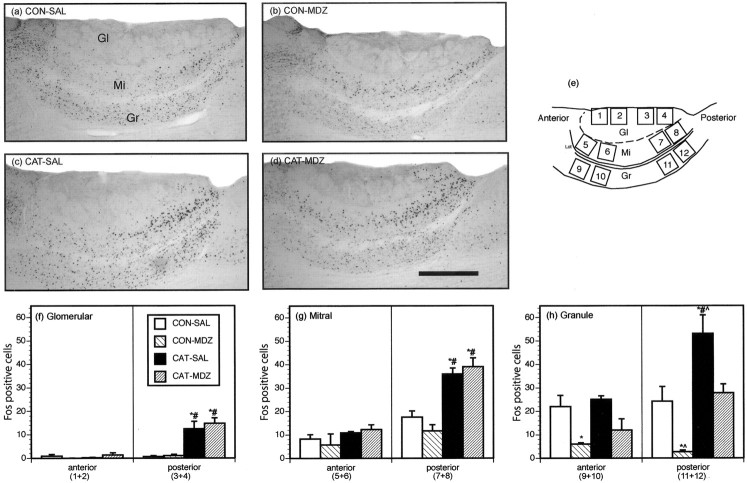
Figure 2.
Results from the AOB. a,b,c, and d show photomicrographs of Fos expression in representative animals from groups CON-SAL, CON-MDZ, CAT-SAL, and CAT-MDZ, respectively. Scalebar, 200 μm. e shows a schematic diagram of a sagittal section of the AOB showing the 12 subregions in which Fos immunoreactivity was quantified. Open squares indicate the position of the 0.25 × 0.25 mm grid within which the Fos counts were made. f, g, and h show Fos counts for the regions in the four experimental groups in the glomerular (Gl), mitral (Mi), and granule (Gr) cell layers, respectively. *p < 0.05, significantly different from CONTROL-SAL group; #p < 0.05, significantly different from CONTROL-MDZ group; ^p < 0.05, significantly different from CAT-MDZ group; Newman-Keuls post hoc tests.

