
Figure 3.
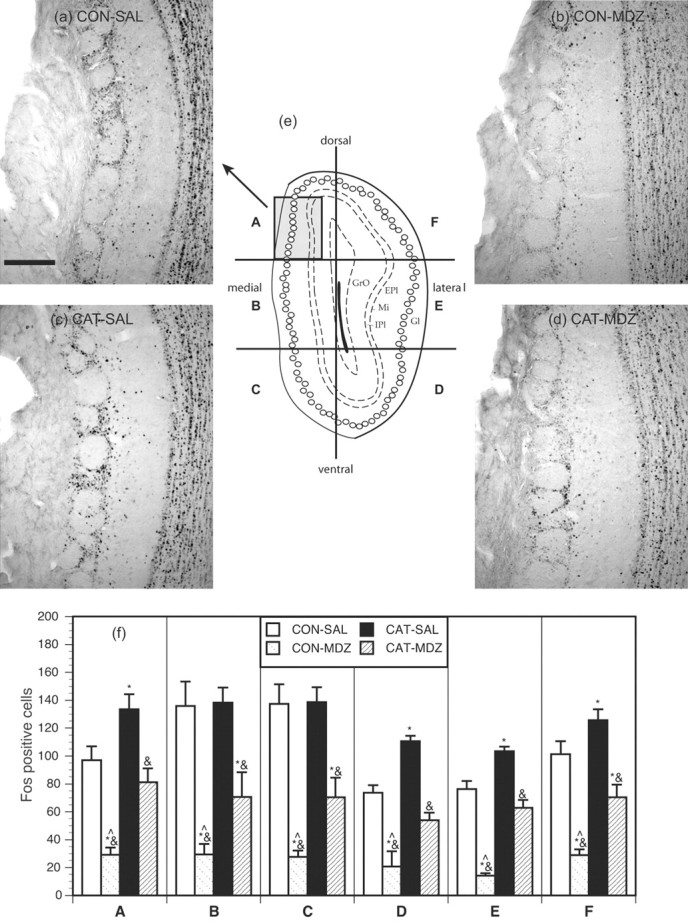
Results from the MOB. a, b, c, and d show photomicrographs of Fos expression in sector A of the MOB from representative animals from groups CON-SAL, CON-MDZ, CAT-SAL, and CAT-MDZ, respectively. Scale bar, 200 μm. e, Schematic diagram, adapted from Paxinos and Watson (1997), showing a coronal section of the MOB indicating approximate position of glomeruli (open circles) and indicating the six sectors (A-F) in which Fos immunoreactivity in the glomerular layer was quantified. The area represented in photomicrographs a-d is shown by the gray square in sector A. f, The counts for sectors A-F in the four experimental groups. *p < 0.05, significantly different from CONTROL-SAL group; &p < 0.05, significantly different from CAT-SAL group; ^p < 0.05, significantly different from CAT-MDZ group; Newman-Keuls post hoc tests. EPl, External plexiform layer; IPl, internal plexiform layer; Gl, glomerular layer; GrO, granule layer.