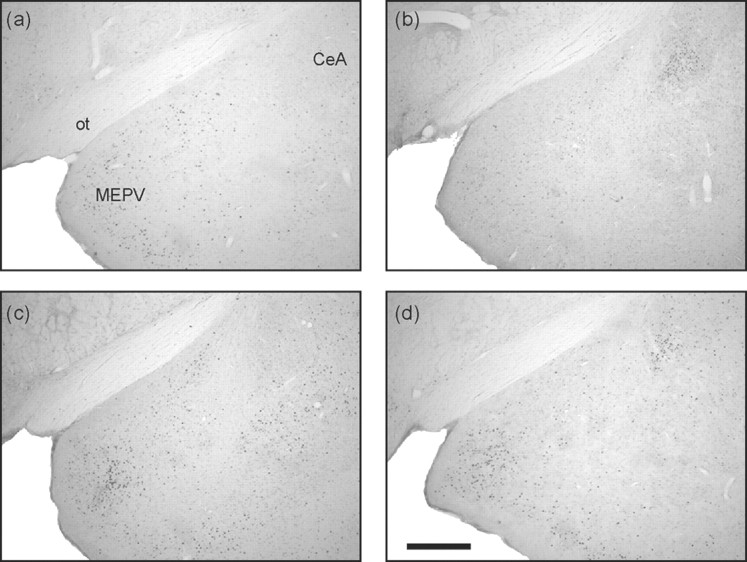
Figure 6.
Photomicrographs of the amygdala. Taken from coronal sections located ∼3.14 mm posterior to bregma showing Fos expression in the amygdala of representative animals from groups CONTROL-SAL (a), CONTROL-MDZ (b), CAT-SAL (c), and CAT-MDZ (d). Note that cat odor increased Fos expression in the medial amygdala (c) and that this was only weakly affected by midazolam (d). Midazolam itself induced Fos expression in the central nucleus (b, d). Scale bar, 500 μm. For location of brain region corresponding to these photomicrographs, see Figure 1, regions 22 and 23. ot, Optic tract; MEPV, medial amygdala (posteroventral); CeA, central nucleus of the amygdala.

