
Figure 7.
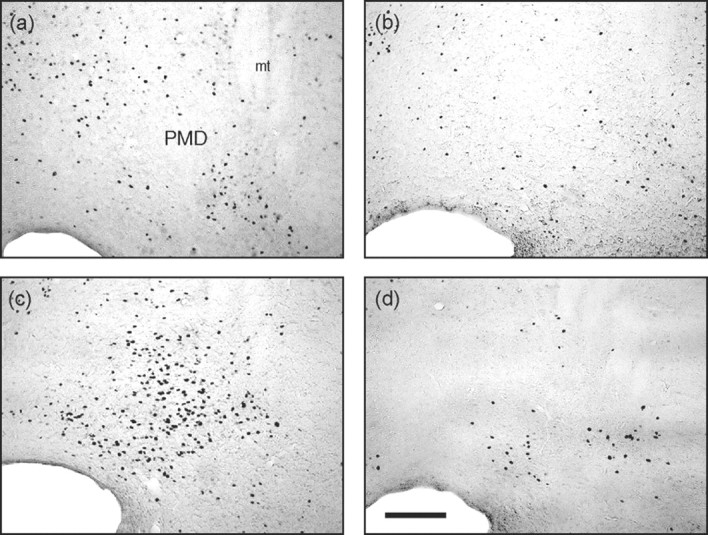
Photomicrographs of the dorsal premammillary nucleus. Taken from coronal sections located ∼4.16 mm posterior to bregma showing Fos-immunoreactive cells from representative rats from groups CONTROL-SAL (a), CONTROL-MDZ (b), CAT-SAL (c), and CAT-MDZ (d). Note the profound inhibition of Fos expression produced by midazolam evident when comparing c and d. Scale bar, 200 μm. For location of brain region corresponding to these photomicrographs, see Figure 1, region 24. mt, Mamillothalamic tract; PMD, dorsal premammillary nucleus.