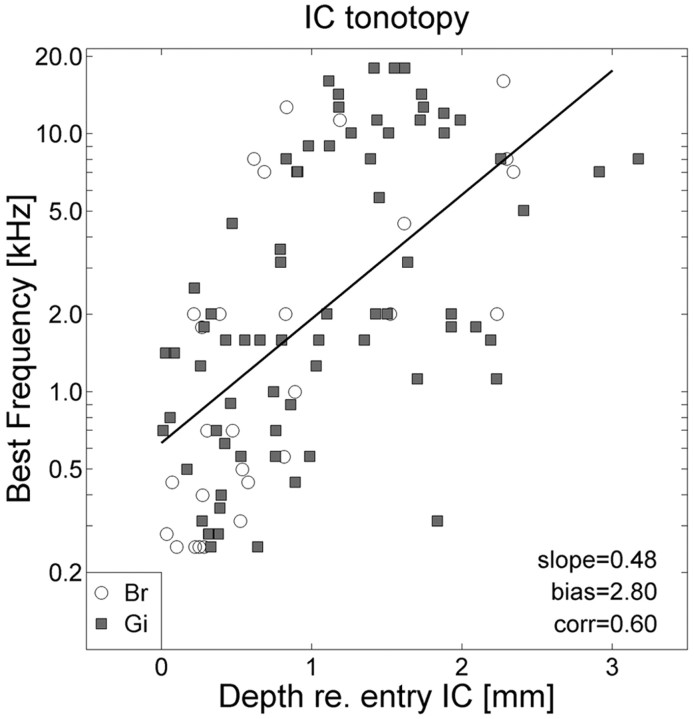
Figure 2.
The BF of IC neurons increases systematically with recording depth (measured with respect to first entry in the IC). White circles, Monkey Br; gray squares, monkey Gi. Solid line, Best-fit regression of log(BF) against depth (in millimeters) for the pooled data of both monkeys (n = 105). Slope, 0.48/mm; bias, 2.80, which corresponds to 630 Hz; correlation, r = 0.60.

