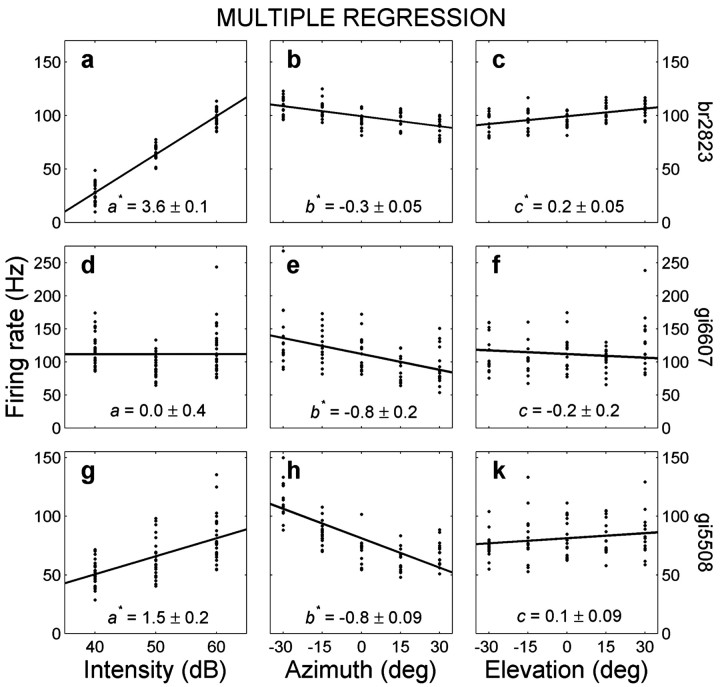
Figure 5.
Result of the multiple linear regression analysis (Eq. 1) to dissociate the systematic sensitivity of a cell to perceived sound level (left column), sound-source azimuth (middle column), and sound elevation (right column) for three different neurons. The top neuron (br2823; a-c) is sensitive to all three parameters (see also Fig. 4a). The center neuron (gi6607; d-f) is sensitive to contralateral sound azimuth (b < 0) but not in a monotonic way to intensity or elevation. The bottom neuron (gi3918; g-k) is sensitive to both contralateral azimuth (b < 0) and sound intensity but not to elevation. Correlation coefficients between data and model are 0.96, 0.52, and 0.65, respectively. Numbers at bottom indicate mean ± SD. *p < 0.05 indicates a regression parameter that differs significantly from zero. Data for each variable are plotted against mean firing rate, after subtracting the weighted contributions from the other two variables.

