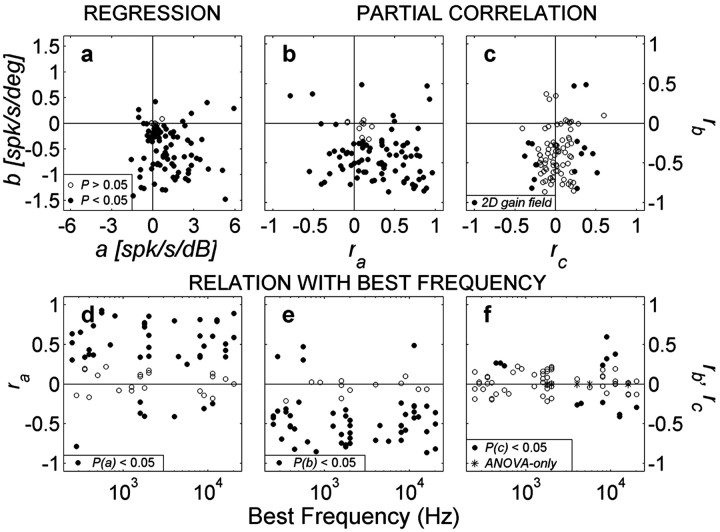
Figure 6.
a, Distribution of regression coefficients for perceived sound level and sound azimuth for all neurons (parameters a, b of Eq. 1; pooled for both monkeys). Filled circles indicate that either parameter a or b differed significantly from zero. b, Partial correlation coefficients rb versus ra. The majority of neurons are tuned to contralateral locations (rb < 0). Most neurons increase their activity with increasing sound level (ra > 0), although a significant group (n = 9) does the reverse. Note the wide range of intensity-azimuth coefficients covered by the population. c, Partial correlations for stimulus azimuth (rb) versus elevation (rc). Filled circles correspond to cells with 2D spatial gain fields (i.e., both b,c ≠ 0). d-f, Bottom panels show the distribution of the partial correlation parameters ra (left), rb (middle), and rc (right) as function of best frequency of each neuron for which a complete frequency tuning curve was obtained (n = 62). Filled circles correspond to significant parameter values. Note the absence of a trend.

