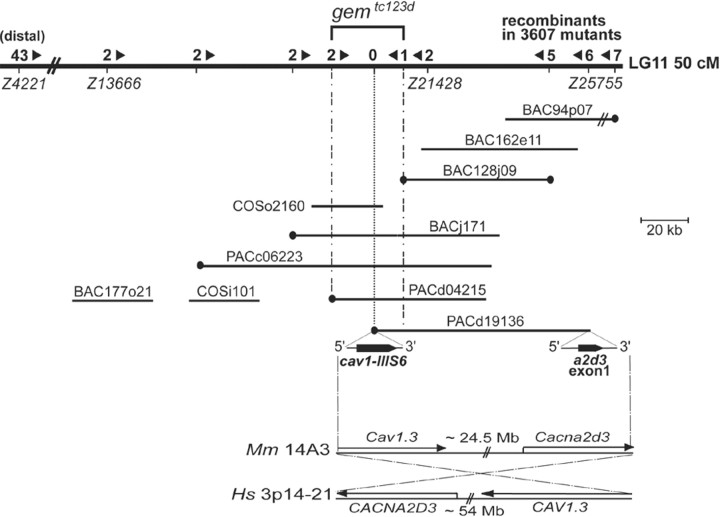
Figure 2.
Integrated genetic and physical map of the gem locus on zebrafish LG11 and syntenic relationships with mammalian genomes. A genomic region of ∼5 cM located at 50 cM from the top of LG11 is shown. The number of recombinants between tested markers and tc123d are shown above the chromosome line. Arrowheads indicate the direction to the mutation. The assembled physical contig of PAC, BAC, and COS clones across the mutant locus is shown underneath the LG line. The scale bar indicates clone insert sizes. BAC94p07 (60 kb) is not drawn to scale. Clone ends depicted by black circles contained Tu/WIK polymorphism(s) and were used as markers to genotype recombinants. The gem critical interval was defined by the retention of one proximal and two distal recombinants at markers d04215/Sp6 and 128j09/T7, respectively. Exons harbored by both ends of PACd19136 are magnified under the clone line, with their respective 5′-3′ orientations. Bottom, Conservation of the cav1/a2d3 synteny in zebrafish, mouse (Mm) (chromosome 14, A3 region; ∼24 Mb from the proximal telomere) and human (Hs) (chromosome 3, p14-21 region; ∼54 Mb from the proximal telomere) genomes.

