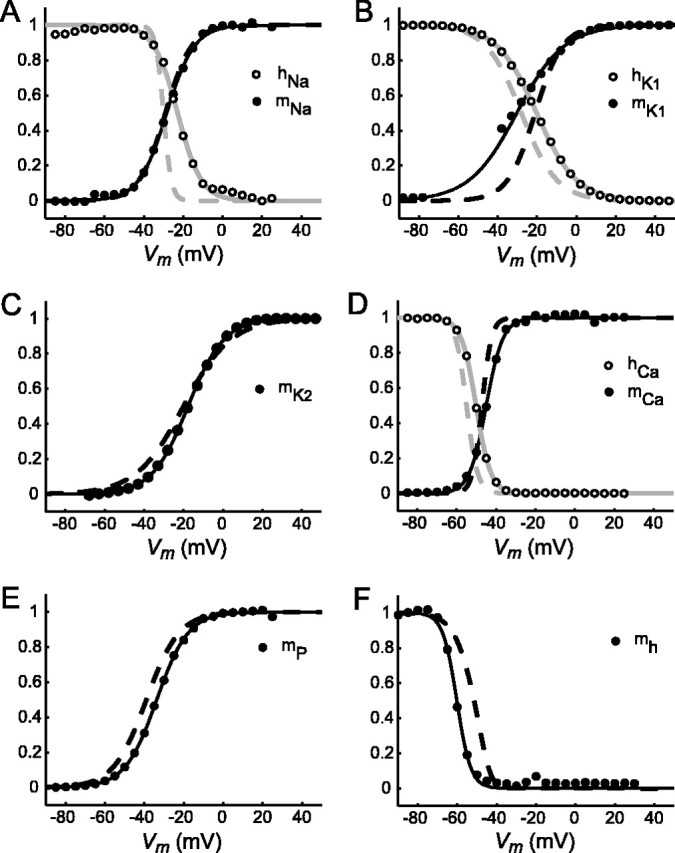
Figure 2.

Steady-state activation and inactivation curves for the silicon neuron. The circles represent data from voltage clamp. Solid lines denote best fit of data to the activation/inactivation equations of Hill et al. (2001). The dashed lines show steady-state activation and inactivation curves for the currents of the canonical mathematical heart interneuron model. A, Fast sodium current (INa). B, Inactivating potassium current (IK1). Data points from -75 to -45 mV are not shown because of large conductance/low current artifact. C, Slow, non-inactivating potassium current (IK2). D, Slowly inactivating low-threshold calcium current (ICaS). E, Persistent sodium current (IP). F, Hyperpolarization-activated inward current (Ih).
