
Figure 3.
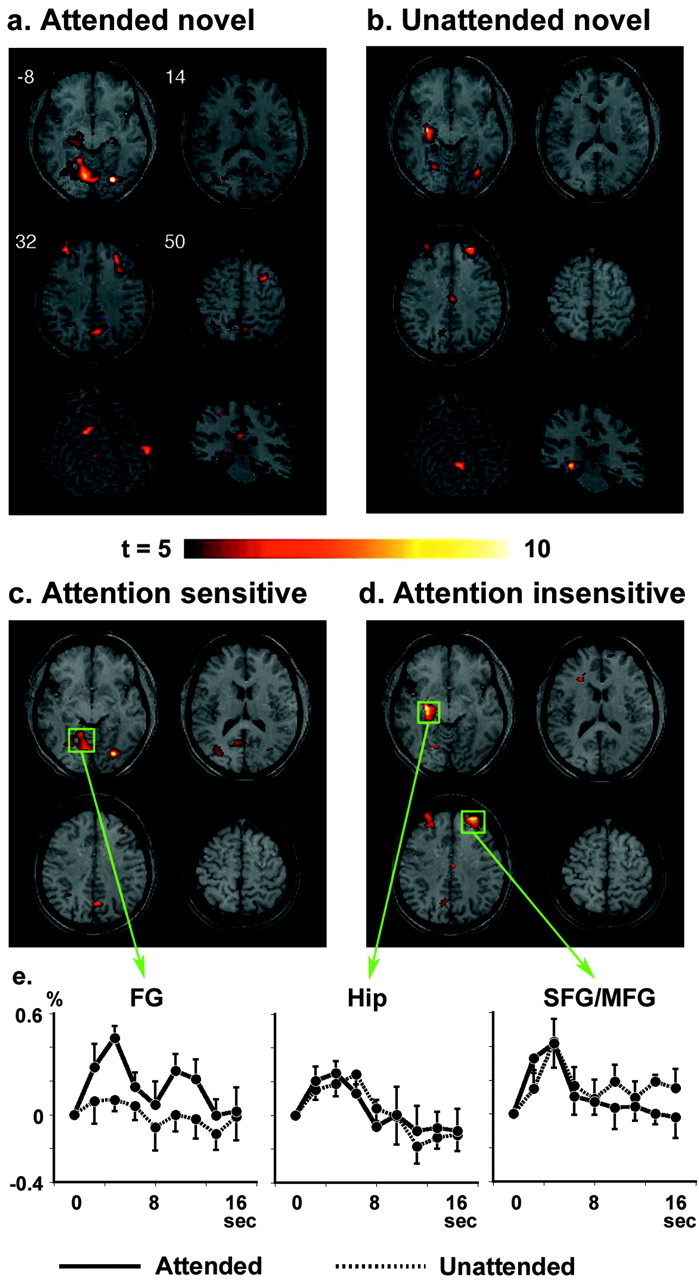
Brain regions activated by attended novel stimuli (a) and unattended novel stimuli (b). The middle panels represent the regions that are sensitive (c) and insensitive (d) to attentional state, resulting from the interaction masking analysis of main stimulus type effect. e, Time course plots of signal changes are shown for attended (solid line) and unattended (dashed line) novel stimuli in the left FG, left Hip, and right SFG/MFG. Solid values represent average ± SEM across 10 subjects. The activation map was overlaid on a normalized structural MRI, which was obtained by transforming high-resolution MP-Flash three-dimensional structural images into standard stereotactic space (Talairach and Tournoux, 1988). The locations of the four axial slices are given in Talairach coordinates (Z values).