
Figure 2.
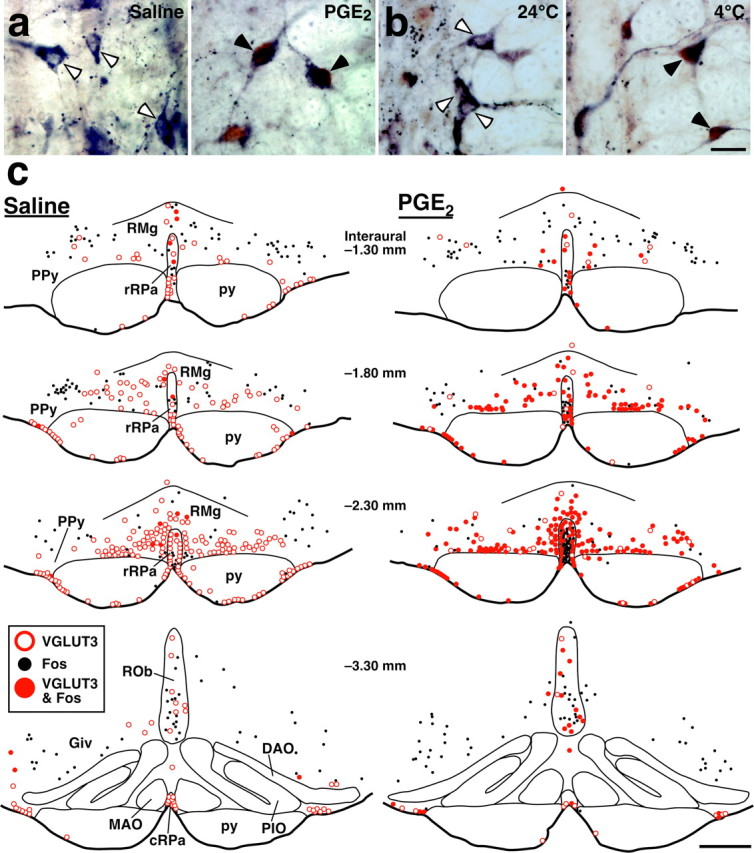
Fos expression in VGLUT3-immunoreactive medullary raphe neurons in response to central PGE2 application and cold exposure. a, b, Double immunoperoxidase staining for VGLUT3 (blue-black) and Fos (brown) in the rRPa and RMg after intracerebroventricular injection of saline or PGE2 (a) and after exposure of rats to environmental temperature of 24 or 4°C (b). The open and filled arrowheads indicate VGLUT3-immunoreactive neuronal cell bodies that are negative and positive for Fos immunoreactivity, respectively. c, Brain maps showing the distribution of VGLUT3-immunoreactive neurons and Fos-immunoreactive cells. Immunoreactive cells in a 20-μm-thick frontal section of the corresponding rostrocaudal position were plotted on a drawing. Scale bars: a, b (in b), 20 μm; c, 500 μm.