Figure 1.
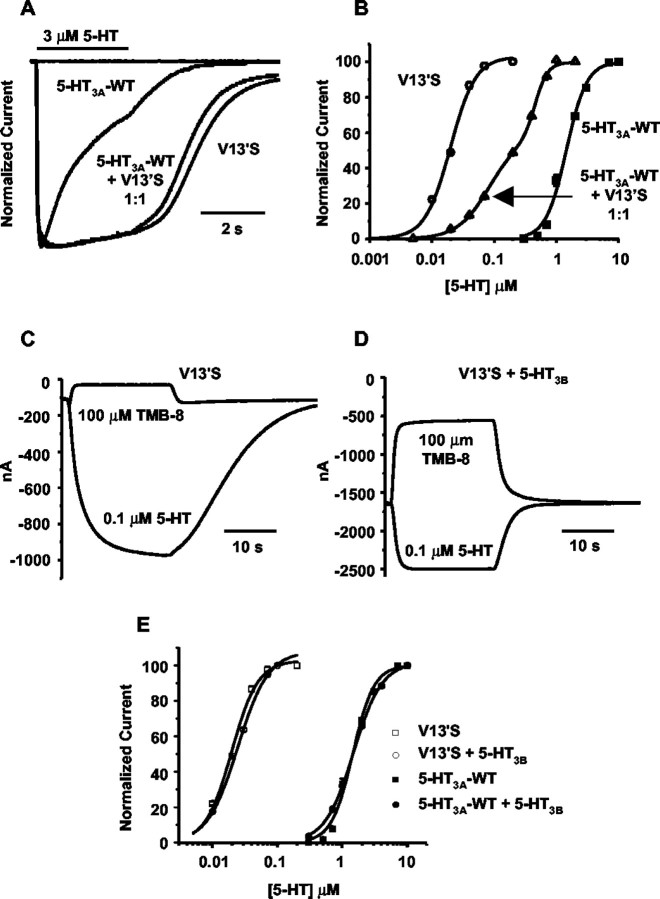
Spontaneous and 5-HT-evoked currents from various combinations of 5-HT3A, V13′S, and 5-HT3B receptor subunits expressed in Xenopus oocytes. A, Representative traces of normalized currents evoked by 3 μm 5-HT at -60 mV. Traces are shown for 5-HT3A-WT, V13′S, and a 1:1 mixture of 5-HT3-WT and V13′S cRNAs. The horizontal bar above the traces represents the duration of ligand perfusion through the recording chamber. The flat trace at the baseline level is typical of responses from both the WT and mutant in the presence of 100 nm tropisetron, a 5-HT3 receptor antagonist. B, Normalized dose-response relationships of oocytes injected with 5-HT3A-WT (solid squares), V13′S (open circles), and a 1:1 mixture of 5-HT3-WT and V13′S (open triangles) cRNAs. C, D, Typical voltage-clamp currents from oocytes injected with V13′S cRNA (C) or with V13′S plus 5-HT3B cRNA 1:1 (D). Holding potential, -60 mV. In each panel, the top trace shows the response to 100 μm TMB-8, and the bottom trace shows the response to 0.1 μm 5-HT. Note the larger leak current at the beginning and end, as well as faster onset and washout to 0.1 μm serotonin in (D). The TMB-8-sensitive leak current denotes spontaneous activation of the receptor. E, Normalized dose-response relationships of homomultimeric (5-HT3A-WT or V13′S only; squares) and heteromultimeric (circles) receptors. Receptors included either the 5-HT3A-WT subunit (solid symbols) or V13′S subunit (open symbols).

