
Figure 9.
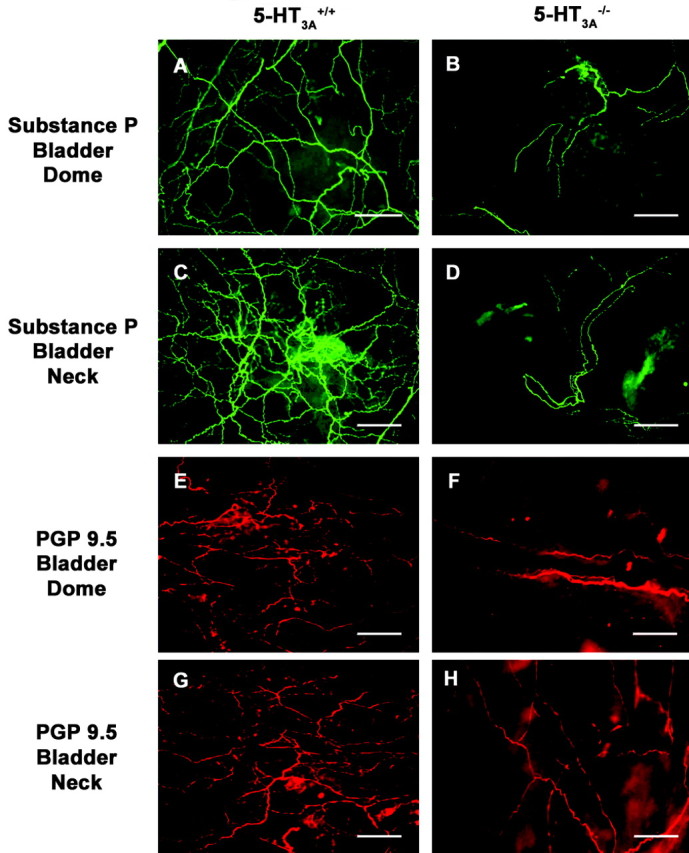
Decreased innervation density in the bladder urothelium of 5-HT3Avs/vs mice. A-H, Representative images of whole-mount bladder immunostaining from 8- to 10-week-old 5-HT3A+/+ (A, C, E, G) and 5-HT3Avs/vs (B, D, F, H) mice (n=3) for Substance P (A-D, green) and PGP 9.5 (E-H, red). Note the decreased density of the fine nerve fibers coursing through the urothelium in both the dome (A, B, E, F) and the neck (C, D, G, H) regions of the urinary bladder. Scale bar: A-H, 50 μm.