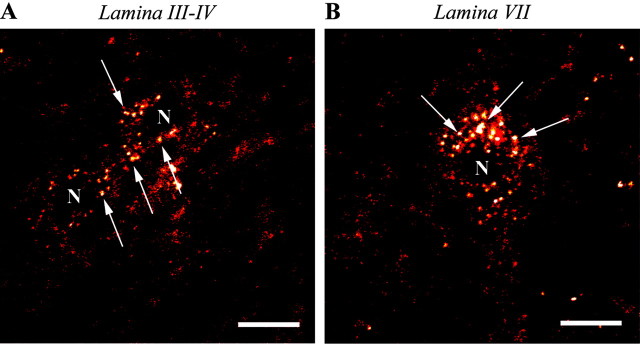
Figure 2.
High-magnification confocal microscopic images of Fluo-DLT-labeled neurons in dorsal and ventral horns of the rat spinal cord. Fluorescent puncta (denoted by arrows), corresponding to internalized Fluo-DLT, are evident throughout the perikaryal cytoplasm, sparing the nucleus (N). Images are displayed in glow-scale, where white represents the highest fluorescence intensity and red represents the lowest (black indicates the absence of fluorescent signal). Scale bar, 10 μm.

