Figure 4.

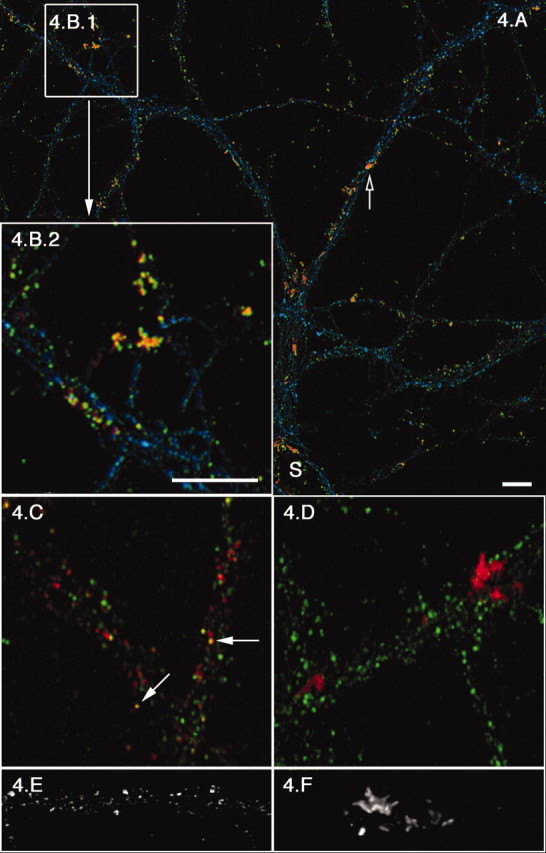
DHPG treatment results in Sar1 tubule reorganization and the selective concentration of NR1 in ER tubule domains. Control (C, E) or DHPG (15 min at a 100 μm final concentration; A, B, D, F) -treated 21 DIV hippocampal neurons were permeabilized, rinsed, incubated with 5 μg of Sar1-GTP, and fixed as described in Figure 1. A is a lower-magnification image of NR1 (green), Sar1 (red), and phalloidin (blue). Open arrows denote hot spots of ER export and Sar1/NR1 colocalization (yellow). B2, which is a 3× magnification of B1, clearly represents the extent of Sar1/NR1 colocalization. C represents a similar region in a control culture (NR1, green; Sar1, red; filled arrows denote sites of colocalization). Specificity of Sar1/NR1 colocalization was controlled for in D, in which there is no colocalization of α subunit of CaMKII (green) with Sar1 (red) in DHPG-treated neurons. A–D are extended focus images compiled from small confocal stacks (sections are 0.1–0.2 μm apart) to avoid false colocalization. E (control) and F (DHPG treated) are 3D reconstructions of Sar1 staining in tertiary dendritic branches. Images were made from confocal stacks with consecutive sections taken 0.1 μm apart. S, Soma. Scale bars, 10 μm.
