Figure 4.
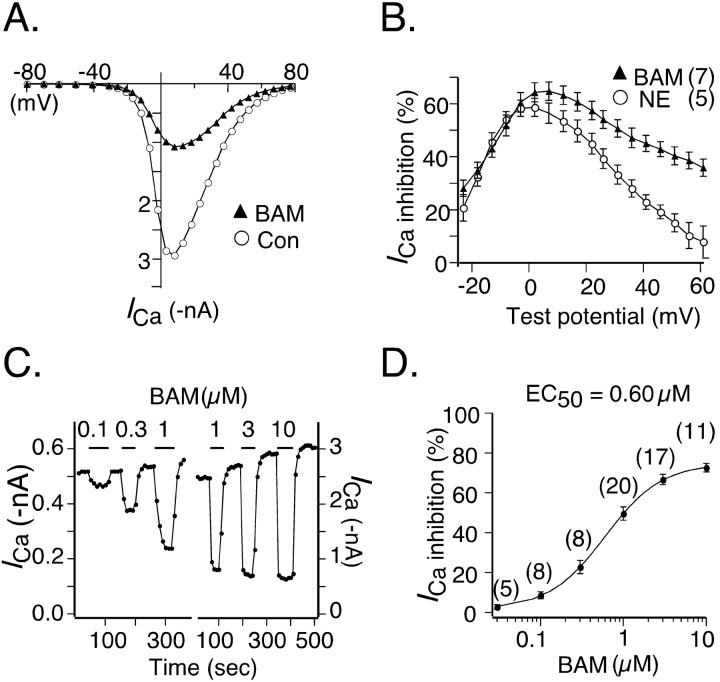
Voltage and concentration dependence of ICa modulation mediated by activation of hSNSR4. A, ICa I-V relationships obtained in the absence (open circles) or presence (filled triangles) of BAM8-22 (BAM; 3 μm) from a neuron previously injected with cDNA encoding hSNSR4. B, Plot of mean (±SEM) percentage ICa inhibition versus test potential. The filled triangles represent data from neurons previously injected with hSNSR4 cDNA (n = 7) and exposed to BAM8-22 (3 μm). For comparison, data from uninjected neurons (n = 5; open circles) treated with NE (10 μm) are superimposed on the plot. C, Time courses of ICa inhibition produced by sequentially increasing concentration of BAM8-22. Data obtained from two separate neurons expressing hSNSR4 are illustrated. In general, three concentrations of agonist were tested for each neuron. D, Concentration-response curve for hSNSR4-mediated mean ICa inhibition. The EC50 for BAM8-22 was determined by fitting the data to the Hill equation using a nonlinear regression algorithm. Numbers of cells tested for each concentration of BAM8-22 are shown in parentheses.

