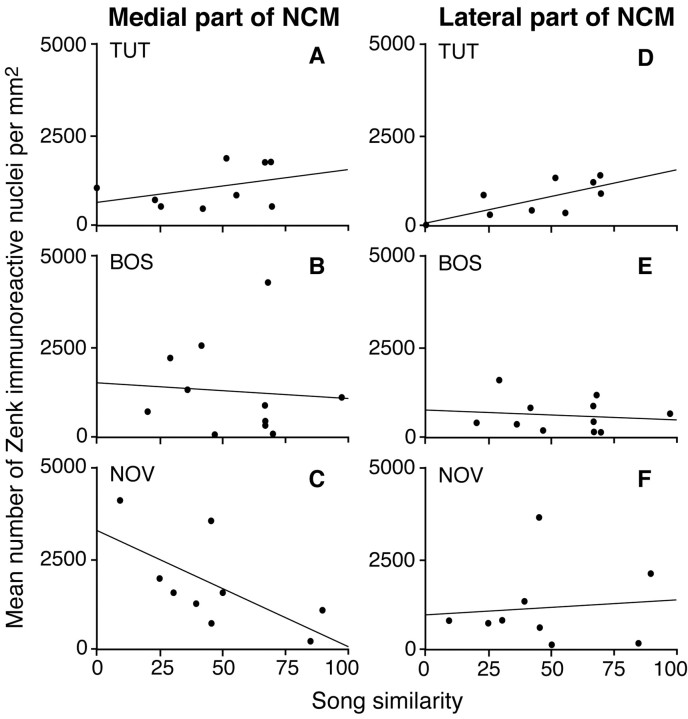
Figure 3.
Scatter plots of mean number of ZENK immunoreactive (IR) nuclei per square millimeter in medial and lateral NCM in relation to the percentage of song elements copied from the tutor song (song similarity) for groups of birds exposed to tutor song (TUT) (A, D), bird's own song (BOS) (B, E), or novel conspecific song (NOV) (C, F).

