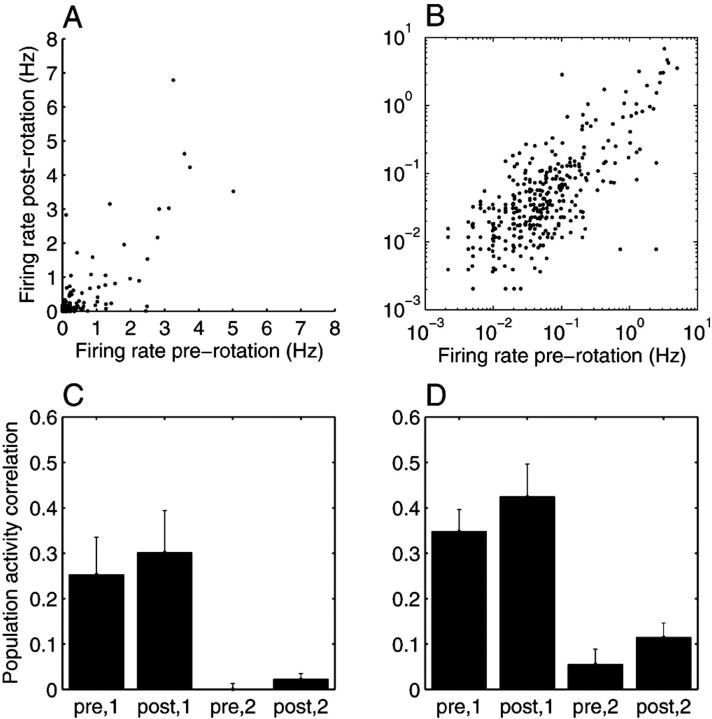
Figure 3.
Quantification of results. A, B, Hippocampal population activity during SIA before and after the arena rotation. A, The mean firing rate of each cell during SIA before the rotation is plotted against its mean firing rate during SIA after the rotation, using all 631 cells from the nine data sets. In general, cells that were active in SIA before the rotation were also active in SIA after the rotation. B, The same data as in A are plotted on a log-log scale to show that even the firing rates of cells that were not very active during SIA (less than ∼1 Hz) were similar in pre-rotation and post-rotation SIA. Grouping together all cells from all data sets, the correlation between the mean pre-rotation SIA and the mean post-rotation SIA population activity vectors was 0.808. The mean ± SEM of the correlation for each individual data set was 0.747 ± 0.095. C, D, For each data set, mean population activity vectors were constructed for pre-rotation SIA, post-rotation SIA, active foraging in the pixel of the arena in which the rat fell asleep, and active foraging in the pixel of the arena to which the rat was rotated, and the correlation coefficient was calculated for each combination of vectors from SIA and active foraging. The means and SEMs of these correlations are plotted for run 1 (C) and run 2 (D). The correlation between the post-rotation SIA vector and the population activity in the location in which the rat fell asleep (post,1) was significantly higher than the correlation between post-rotation SIA and the population activity in the location to which the rat was rotated (post,2), using run population activity vectors from either run 1 (p = 0.01) or run 2 (p = 0.001).

