
Figure 6.
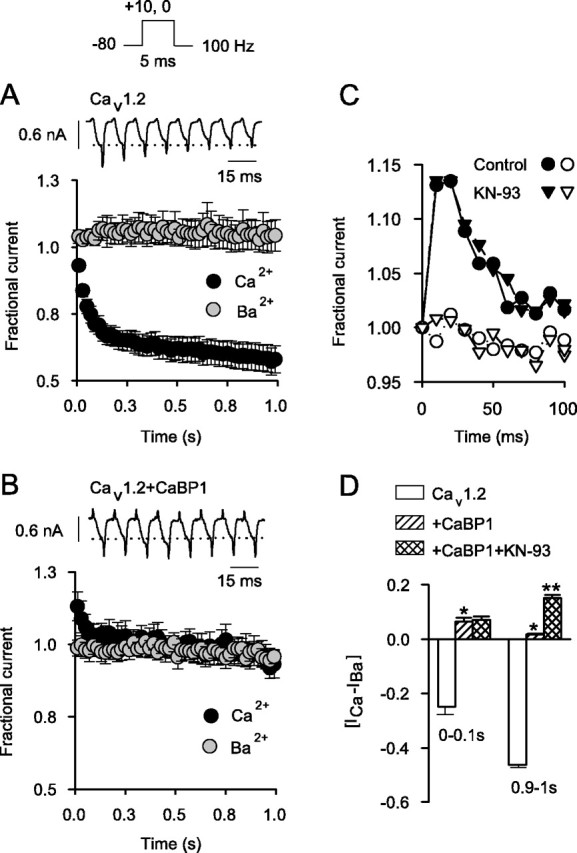
CaBP1 blocks Ca2+-dependent inactivation and causes facilitation during repetitive stimuli. A, Ca2+-dependent inactivation of Cav1.2 during trains of depolarizations. ICa and IBa were evoked by 5 msec test pulses from -80 to +10 mV for ICa or 0 mV for IBa as shown in voltage protocol above. Shown are representative traces of ICa during the first eight pulses. Dotted line indicates initial current amplitude. Fractional current, plotted below, represents test current amplitude normalized to that for the first pulse in the train and plotted against time for ICa(black circles; n = 11) and IBa (gray circles; n=5). Points represent the mean ± SEM, and every other point is plotted. B, Loss of Ca2+-dependent inactivation but gain of ICa facilitation with CaBP1. Current traces (top) and fractional current (bottom) were obtained as in A, except that recordings were from cells cotransfected with CaBP1 (n = 5 for ICa; n = 4 for IBa). C, Ca2+-dependent facilitation in cells cotransfected with CaBP1 is not prevented by KN-93. Facilitation of ICa (filled symbols) but not IBa (open symbols) is shown for cells cotransfected with Cav1.2 plus CaBP1 recorded with control intracellular solution (circles) or that containing the CaM kinase II inhibitor KN-93 (2 μm; triangles). Results were obtained as in A; and data from single representative cells were plotted for the first 100 msec of the train. D, Effects of CaBP1 on Ca2+-dependent modulation of Cav1.2. [ICa - IBa] represents the difference between the average fractional current for ICa and IBa for the first 10 (0-0.1 sec) or last 10 (0.9-1 sec) pulses. Shown are results obtained from cells transfected with Cav1.2 alone (n = 11), Cav1.2 plus CaBP1 (n = 5), and cells cotransfected with Cav1.2 plus CaBP1 that were treated with KN-93 (n = 5) (*p < 0.05 compared with Cav1.2 alone; **p < 0.01 compared with Cav1.2 plus CaBP1).