
Figure 4.
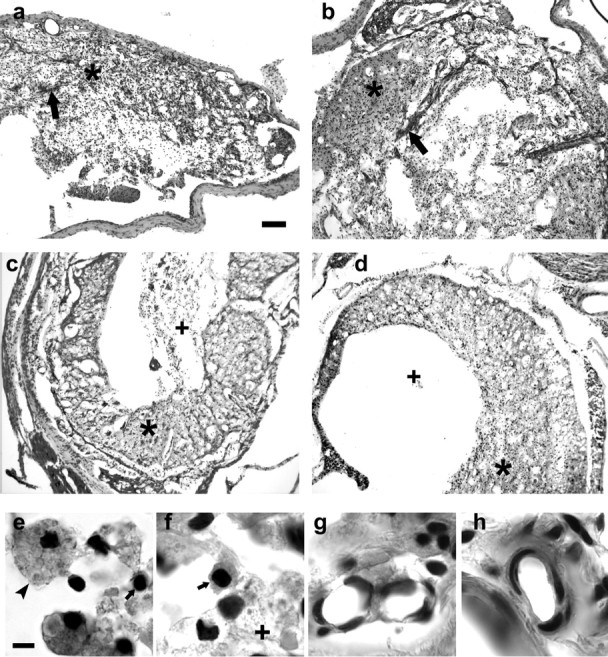
Morphological and cellular characteristics of the lesion site at T4 (6 weeks) and T12 (12 weeks) in control and mAb-treated rats. Low-power photomicrographs of sections stained with hematoxylin and eosin show the general appearance of the lesion at T4 in control (a) and mAb-treated (b) rats and at T12 in control (c) and mAb-treated rats (d). Asterisks on panels indicate areas containing inflammatory cells. Large arrows on a and b indicate bands of fibrovascular tissue. Plus signs (+) indicate areas of necrotic debris. e and f illustrate examples of foamy macrophages (arrowhead) and lymphocytes (small arrow) present in these lesions. An area of necrotic debris is indicated by the + in f. g and h show examples of arterioles within bundles of fibrous tissue. Scale bars: (in a) a-d, 100 μm; (in e) e-h,= 5.0 μm.