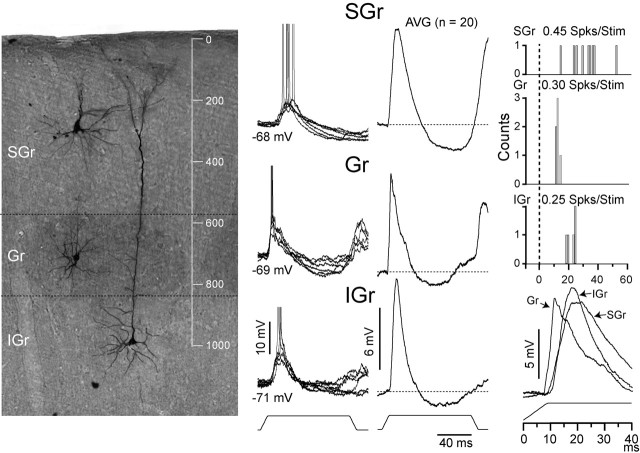
Figure 1.
Differences between cells from different layers. Examples of an SGr cell recorded at 280 μm depth, a Gr spiny stellate cell recorded at 710 μm, and an IGr cell with a bitufted apical dendrite recorded at 990 μm are shown. Cells were photographed and superimposed on a background of cytochrome oxidase-treated tissue. Cells were placed according to their original positions and are shown on the same background for simplicity. The axon of the spiny stellate cells can be seen ascending toward supragranular layers. The left column shows superimposed individual responses (n = 6) at the resting Vm (indicated) to the highest velocity. Averages (AVG;n = 21) are shown in the middle column. The right column shows the PSTHs (bin, 1 msec); firing rate is indicated. At the bottom of the right column, the responses to the highest velocity from the three cells were superimposed to highlight their differences. Spks/Stim, Spikes per stimulus.

