
Figure 10.
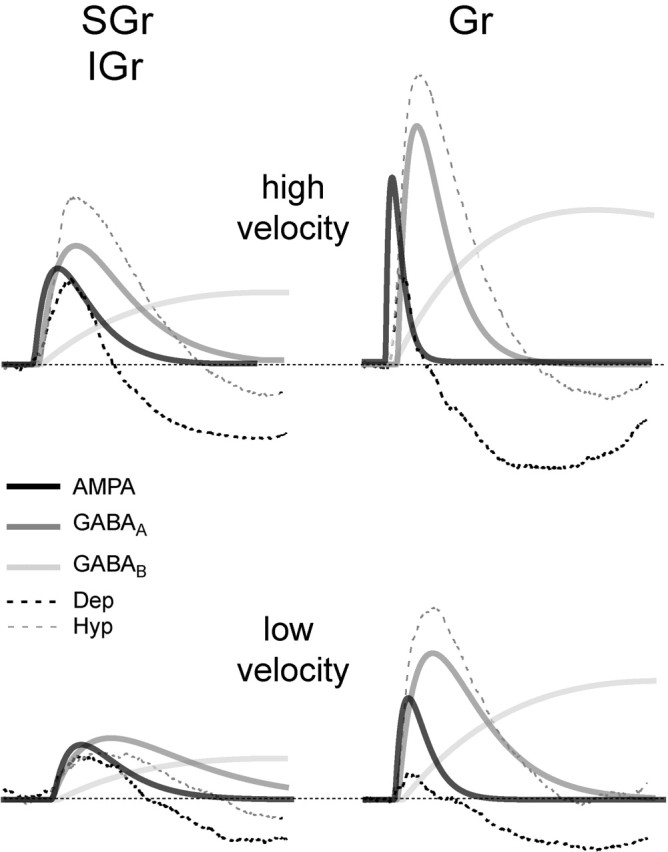
Schematic representation of the hypothetical arrangement of conductances underlying the synaptic responses. Excitatory, (AMPA, black) and inhibitory (GABAA, dark gray; GABAB, light gray) were drawn as α functions with an arbitrary amplitude and time constant. Conductances are represented superimposed on the population synaptic responses to the highest velocity-acceleration of SGr (left) and Gr (right) cells at a depolarized (Dep; black dotted) and hyperpolarized (Hyp; gray dotted) Vm. The left column is labeled SGr/IGr because, for purposes of this schematic, we considered the responses from these layers as equivalent in comparison with Gr layer. The population responses are the same shown in Figure 8. We chose not to represent NMDA currents for simplicity (but see Feldmeyer et al., 1999). The three main points are as follows: (1) the time separation between AMPA and GABAA in Gr cells, which is enhanced in the response to the high velocity-acceleration (top right); (2) the amplitude of GABAA conductance, which is highest in Gr cells and dominates the response at all velocities once activated, and (3) the decrease in latency and increase in amplitude in all conductances with the increase in velocity-acceleration.