
Figure 6.
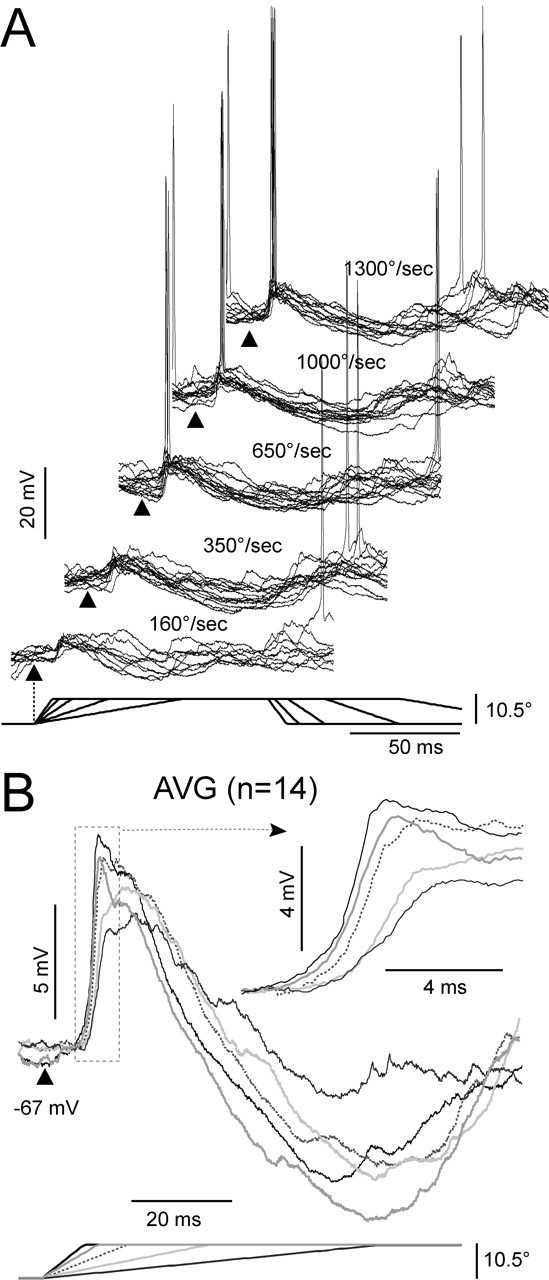
Responses to deflection of the PW at increasing values of velocity-acceleration. Responses are at the resting Vm (-67 mV) from a cell recorded at 850 μm depth. A, Single trial responses (n = 10 or 12) are superimposed for each of the five velocities (indicated above each group of responses). Traces were artificially offset in the x- and y-axis for clarity. Ramp and hold stimulus is represented at the bottom. Triangles indicate the beginning of the stimulus. B, Averages from all responses (n = 14) at each velocity-acceleration. Each velocity-acceleration is represented according to the stimulus at the bottom. Inset highlights the upstroke of the response (dotted rectangle).